Fig. 5
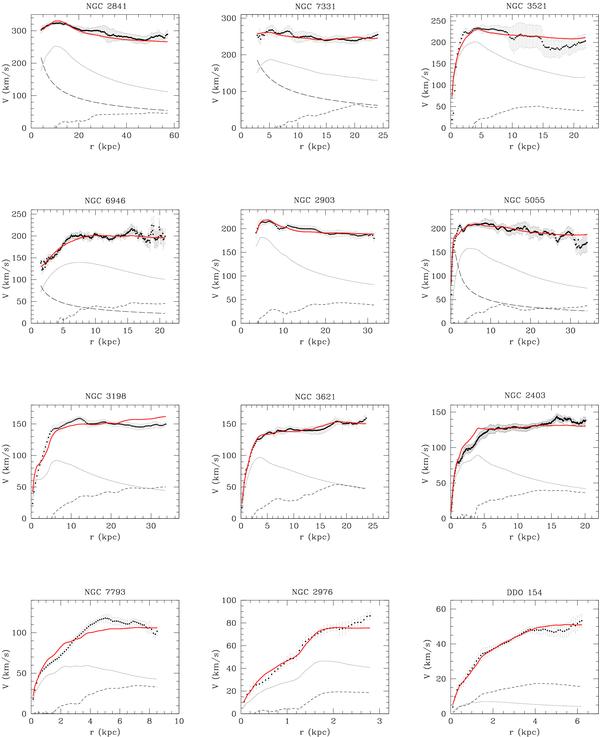
Rotation curve fits with the distance “constrained” and a0 = 1.22 × 10⁻⁸ (μ simple d constr. in Table 2). Dashed, dotted, and long-dashed lines represent the Newtonian contributions of the gaseous disk, stellar disk, and bulge, respectively. The MOND best-fit model is shown as a solid red line.
Current usage metrics show cumulative count of Article Views (full-text article views including HTML views, PDF and ePub downloads, according to the available data) and Abstracts Views on Vision4Press platform.
Data correspond to usage on the plateform after 2015. The current usage metrics is available 48-96 hours after online publication and is updated daily on week days.
Initial download of the metrics may take a while.