Fig. 8
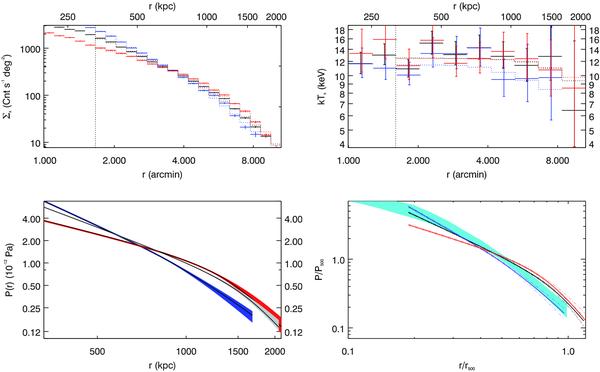
A2163-A profiles associated with the overall cluster (in black) and the eastern and western cluster sectors shown on Fig. 7 (in red and blue, respectively). Top: gas surface brightness (left) and projected temperature profiles (right). Bottom left: ICM pressure profiles modelled to fit surface brightness and projected temperature. Bottom right: ICM pressure profiles re-scaled to the characteristic pressure of a self-similar cluster with mass M500. The distribution of scaled pressure profiles measured in a representative sample of nearby galaxy clusters (REXCESS, Arnaud et al. 2010) has been overlaid in light blue.
Current usage metrics show cumulative count of Article Views (full-text article views including HTML views, PDF and ePub downloads, according to the available data) and Abstracts Views on Vision4Press platform.
Data correspond to usage on the plateform after 2015. The current usage metrics is available 48-96 hours after online publication and is updated daily on week days.
Initial download of the metrics may take a while.