Free Access
Fig. 7
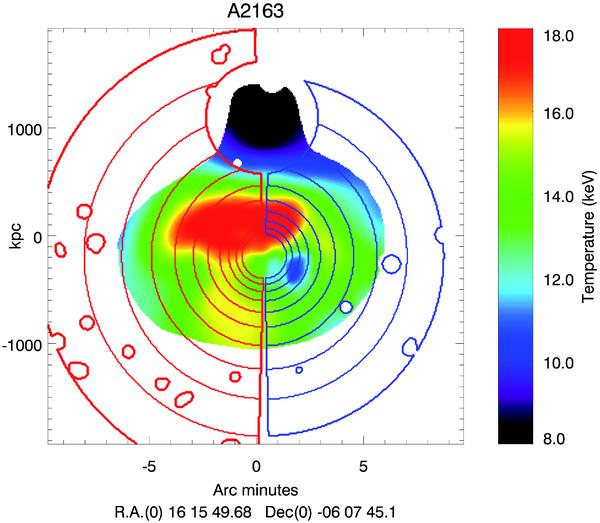
A2163 gas temperature map with two complementary profile extraction regions overlaid. The blue region is expected to be located ahead of the moving cool core, while the red region is expected to be located behind. Both regions are centred on the X-ray emission peak.
Current usage metrics show cumulative count of Article Views (full-text article views including HTML views, PDF and ePub downloads, according to the available data) and Abstracts Views on Vision4Press platform.
Data correspond to usage on the plateform after 2015. The current usage metrics is available 48-96 hours after online publication and is updated daily on week days.
Initial download of the metrics may take a while.