Fig. 6
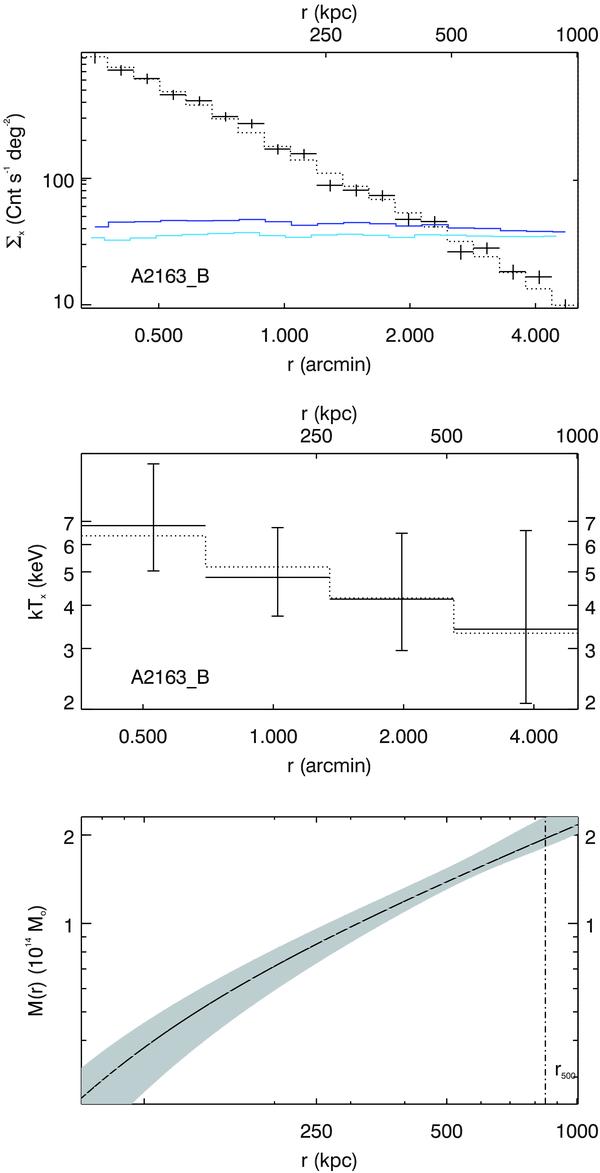
A2163-B. Top: ICM surface brightness profile. Light blue: blank-sky background emissivity. Blue: blank-sky background and main cluster emissivity. Middle: projected ICM temperature profile. Bottom: mass profile modelled from the surface brightness and projected temperature profiles, assuming ICM hydrostatic equilibrium. The ICM surface brightness and projected temperature have been modelled analytically (see dotted lines on the corresponding plots).
Current usage metrics show cumulative count of Article Views (full-text article views including HTML views, PDF and ePub downloads, according to the available data) and Abstracts Views on Vision4Press platform.
Data correspond to usage on the plateform after 2015. The current usage metrics is available 48-96 hours after online publication and is updated daily on week days.
Initial download of the metrics may take a while.