Fig. 5
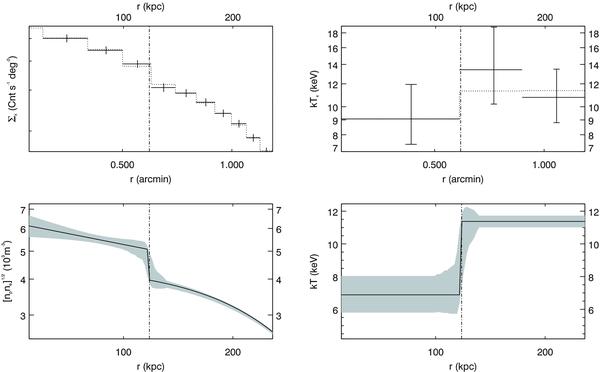
Top profiles: ICM brightness (left) and projected temperature (right) profiles corresponding to the sector illustrated in the bottom-left panel of Fig. 4. Bottom profiles: ICM density and 3D temperature modelled as disrupted distributions with common jump position (the dot-dashed line, see also Sect. 4.2 and Eqs. (6) and (7)). The ICM emissivity corresponding to these radial distribution has been fitted to the ICM brightness and projected temperature, as shown by dotted line on the top profiles.
Current usage metrics show cumulative count of Article Views (full-text article views including HTML views, PDF and ePub downloads, according to the available data) and Abstracts Views on Vision4Press platform.
Data correspond to usage on the plateform after 2015. The current usage metrics is available 48-96 hours after online publication and is updated daily on week days.
Initial download of the metrics may take a while.