Fig. 4
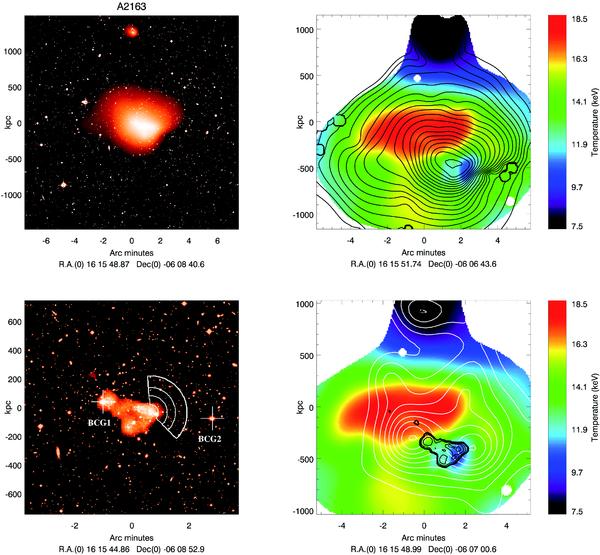
A2163. Left panels: X-ray emission overlaid on galaxy maps. Optical observations performed at the MPI 2.2 m telescope, see Paper I (Maurogordato et al. 2008). X-ray images obtained from wavelet analyses of a Chandra exposure in the 0.5–2.0 keV band. Top-left: overall cluster emission. Bottom-left: high resolution analysis of the ICM emission near the cluster centre, see Sect. 3.3 for details. Right panels: ICM temperature maps obtained from wavelet spectral-imaging analysis of the EPIC-XMM-Newton data set. Top-right: black iso-contours from the Chandra image (same as top-left map). Bottom-right: black iso-contours from high resolution Chandra residue (same as bottom-left map); white iso-contours from projected galaxy density map (see also Fig. 6 in Paper I).
Current usage metrics show cumulative count of Article Views (full-text article views including HTML views, PDF and ePub downloads, according to the available data) and Abstracts Views on Vision4Press platform.
Data correspond to usage on the plateform after 2015. The current usage metrics is available 48-96 hours after online publication and is updated daily on week days.
Initial download of the metrics may take a while.