| Issue |
A&A
Volume 527, March 2011
|
|
|---|---|---|
| Article Number | A60 | |
| Number of page(s) | 42 | |
| Section | Catalogs and data | |
| DOI | https://doi.org/10.1051/0004-6361/201014879 | |
| Published online | 25 January 2011 | |
VLT-VIMOS integral field spectroscopy of luminous and ultraluminous infrared galaxies
III. The atlas of the stellar and ionized gas distribution
1
Instituto de Estructura de la Materia (CSIC),
C/Serrano 121,
28006
Madrid,
Spain
e-mail: This email address is being protected from spambots. You need JavaScript enabled to view it.
2
European Organization for Astronomical Research in the Southern
Hemisphere (ESO), Karl-Schwarzschild-Strasse 2, 85748
Garching bei München,
Germany
3
Laboratorio de astrofísica espacial y física fundamental (LAEFF),
Apartado 78, 28691 Villanueva de la
Cañada, Madrid,
Spain
4
Astrophysikalisches Institut Postdam, An der Sternwarte 16, 14482
Potsdam,
Germany
5
Instituto de Astrofísica de Andalucía,
CSIC, Glorieta de la Astronomía
s/n, 18008
Granada,
Spain
Received:
28
April
2010
Accepted:
12
August
2010
Abstract
Context. Luminous and ultraluminous infrared galaxies (LIRGs and ULIRGs) are much more numerous at higher redshifts than locally, dominating the star-formation rate density at redshifts ~1–2. Therefore, they are important objects in order to understand how galaxies form and evolve through cosmic time. Local samples provide a unique opportunity to study these objects in detail.
Aims. We aim to characterize the morphologies of the stellar continuum and the ionized gas (Hα) emissions from local sources, and investigate how they relate with the dynamical status and IR-luminosity of the sources.
Methods. We use optical (5250–7450 Å) integral field spectroscopic (IFS) data for a representative sample of 38 sources (31 LIRGs and 7 ULIRGs), taken with the VIMOS instrument on the VLT.
Results. We present an atlas of IFS images of continuum emission, Hα emission, and Hα equivalent widths for the sample. The morphologies of the Hα emission are substantially different from those of the stellar continuum. The Hα images frequently reveal extended structures that are not visible in the continuum, such as HII regions in spiral arms, tidal tails, rings, bridges, of up to few kpc from the nuclear regions. The morphologies of the continuum and Hα images are studied on the basis of the C2 kpc parameter, which measures the concentration of the emission within the central 2 kpc. The C2 kpc values found for the Hα images are higher than those of the continuum for the majority (85%) of the objects in our sample. On the other hand, most of the objects in our sample (~62%) have more than half of their Hα emission outside the central 2 kpc. No clear trends are found between the values of C2 kpc and the IR-luminosity of the sources. On the other hand, our results suggest that the star formation in advance mergers and early-stage interactions is more concentrated than in isolated objects. Finally, we compared the Hα and infrared emissions as tracers of the star-formation activity. We find that the star-formation rates derived using the Hα luminosities generally underpredict those derived using the IR luminosities, even after accounting for reddening effects.
Key words: galaxies: interactions / galaxies: starburst / techniques: spectroscopic
© ESO, 2011
1. Introduction
The advent of the new infrared (IR), sub-millimeter (sub-mm) and millimeter (mm) facilities such as for example the Spitzer Space Telescope, the Submillimeter (sub-mm) Common User Bolometer Array (SCUBA), and the Max-Planck Millimeter Bolometer (MAMBO) array, have made it possible to extend deep cosmological surveys from the UV/optical to the IR, sub-mm and mm wavelengths (e.g. Hughes et al. 1998; Pérez-González et al. 2005; Coppin et al. 2006; Austermann et al. 2009; Lonsdale et al. 2009). These surveys revealed the presence of high-z galaxies with luminosities, morphologies and sizes consistent with those of the local luminous (LIRGs, 1011 < LIR < 1012 L⊙, LIR = 8–1000 μm) and ultraluminous (ULIRGs, LIR > 1012 L⊙) infrared galaxies (e.g. Conselice et al. 2005). Follow-up studies of these high-z (U)LIRGs showed that a large fraction of these objects were actively forming stars at redshifts 1–4. Furthermore, they dominate the star-formation rate (SFR) density at redshifts z > 1, and form a large fraction of the newborn stars at redshifts z ~ 1.5 (Pérez-González et al. 2005).
A great effort has been made during the last years to study in detail the properties of LIRGs and ULIRGs in the local universe (e.g. Tacconi et al. 2002; Dasyra et al. 2006; Alonso-Herrero et al. 2006; Armus et al. 2007; Nardini et al. 2009; Rodríguez Zaurín et al. 2010; Clements et al. 2010), and at moderate redshifts (z ~ 1–2) (e.g. Farrah et al. 2009; Fiolet et al. 2009). These studies have provided us with some detailed information about the physical processes taking place in these objects. However, to have a comprehensive picture of how galaxies form and evolve from the distant to the local universe we need detailed studies of (U)LIRGs kinematics, internal structure, stellar populations and excitation conditions. These detailed studies require high S/N two-dimensional spectroscopic information with both high angular and spectral resolutions.
Up to date, optical and near-IR IFS studies of local (U)LIRGs have usually concentrated on individual objects (e.g. Colina et al. 1999; Arribas et al. 2001; García-Marín et al. 2006; Bastian & Goodwin 2006; Bedregal et al. 2009; Lípari et al. 2009b,a) or relatively small samples (Colina et al. 2005; Monreal-Ibero et al. 2006; García-Marín et al. 2009b). To remedy this situation we are carrying out a program with the aim of studying the internal structure and kinematics of a large (~70), representative sample of LIRGs and ULIRGs using several optical and near-IR integral field spectroscopic facilities.
This is the third of a series of studies based on VLT-VIMOS observations. Arribas et al. (2008), hereafter Paper I, presented the sample, data reduction and analysis techniques, as well as preliminary results obtained for two individual sources, IRAS F06076-2139 and IRAS F12115-4656. A detailed study of the ionization in the extra-nuclear extended regions can be found in Monreal-Ibero et al. (2010), hereafter Paper II.
In this paper we present an atlas of reconstructed maps of continuum, Hα line emission flux and Hα equivalent width (Hα − EW) tracing the stellar component, the ongoing star-formation activity and the presence of ionizing shocks or an active galactic nucleus (AGN). We also perform a basic structural analysis of these images and look for trends and correlations between the morphological properties of the objects and other properties of LIRGs/ULIRGs. Finally, we compare the Hα and IR luminosities as tracers of the star-formation activity.
Throughout the paper we will consider H0 = 70 km s-1 Mpc-1, ΩΛ = 0.7, ΩM = 0.3.
2. The VIMOS sample: observations, data reduction and line fitting
2.1. The sample
The IFS (U)LIRG survey is a large program that started with the aim of studying the 2D-internal structure and kinematics of low-z LIRGS and ULIRGs. The survey was carried out using integral field spectroscopic facilities in both the northern (INTEGRAL, Arribas et al. 1998; PMAS, Roth et al. 2005) and the southern (VIMOS, Le Fèvre et al. 2003; SINFONI, Bonnet et al. 2004) hemispheres, and includes ~70 sources. The VIMOS sample discussed in this paper contains a total of 38 galaxies, which are listed in Table 1. Thirty one of these galaxies are classified as LIRGs. The LIRG subsample is drawn from the IRAS Revised Bright Galaxy Sample (RBGS, Sanders et al. 2003), and has a mean redshift of 0.024. The other seven objects in the sample are classified as ULIRGs, and were selected from the IRAS 1 Jy sample of ULIRGs (Kim & Sanders 1998), the RBGS, and from the HST/WFPC2 snapshot sample (ID 6346 PI: Borne). The ULIRG subsample has a mean redshift of 0.069. Possible biases owing to the higher redshifts of the subsample of ULIRGs are discussed later in the paper.
The VIMOS sample is not complete either in luminosity or distance. However, one of the aims of our project was to investigate how the properties of (U)LIRGs correlate with the different morphologies of the objects. Therefore, since the VIMOS sample is certainly representative of the different morphologies within the (U)LIRG phenomenon, it is adequate for the purposes of this work.
General properties of the (U)LIRGs in the VIMOS sample.
2.2. Morphological classification
We use here the simple morphological scheme defined in Paper I. In that paper a preliminary classification was presented for all the objects discussed here. Here, we revisit this classification and describe in detail the criteria and the datasets used (see also Paper II).
The Arribas et al. (2008) scheme is a simplified version of that proposed by Veilleux et al. (2002) for ULIRGs, but with only three morphological classes instead of the five classes (plus four subclasses) presented in Veilleux et al. (2002). In particular, the three different morphological classes considered are
-
Class 0: objects that appear to be single isolated objects, with a relatively symmetric morphology and without evidence for strong past or ongoing interaction;
-
Class 1: objects in a pre-coalescence phase with two well differentiated nuclei separated a projected distance of D > 1.5 kpc. For these objects, it is still possible to identify the individual merging systems and their corresponding tidal structures due to the interaction. The limit of 1.5 kpc was considered taking into account that theoretical models predict a fast coalescence phase after the nuclei become closer than that distance (e.g. Mihos & Hernquist 1996; Bendo & Barnes 2000; Naab et al. 2006);
-
Class 2: objects with two nuclei separated a projected distance of D ≤ 1.5 kpc or single nucleus with a relatively asymmetric morphology suggesting a post-coalescence merging phase. For objects classified as Class 2, it is not possible to individually identify the interacting systems.
Table 1 shows the morphological classification for all the objects discussed in this paper. For this classification we have used the Digitized Sky Survey1. At this stage it is worth mentioning that any morphological classification is to some extent a matter of personal choice. With that in mind the objects in our sample were classified independently by three of us. The level of agreement was substantially high (we agreed except for three objects). Finally, note that some objects in Table 1 have more than one morphological classification assigned. These objects were particularly hard to classify. The preferred morphological classification is indicated in the first place.
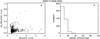 |
Fig. 2 Example of the test performed to estimate the error percentage associated to the relative flux for the particular case of IRAS 13229-2934. Left: standard error of the mean (SE) plotted against the mean value of the flux per spaxel. Right: percentage error distribution. We find that the typical error associated to the flux in this case is 9.8%. |
2.3. Observation data reduction and line fitting
A detailed description of the observations, data reduction and line fitting techniques can be found in Paper I. To summarize, the observations were carried out in service mode during periods 76, 78 and 81 using the Integral Field Unit of the VIMOS instrument (Le Fèvre et al. 2003), on the Very Large Telescope (VLT), with the high-resolution mode “HR-Orange” (grating GG435). The field of view (FOV) and the spatial scale in this mode are 27 arcsec × 27 arcsec and 0.67 arcsec per fiber respectively (i.e., 40 × 40 fibers, 1600 spectra). A square four-pointing dithering pattern was used, with a relative offset of 2.7 arcsec (i.e. four spaxels). The exposure time per pointing was in the range 720–850 s and therefore, the total integration time per galaxy is 2880–3400 s.
The data were reduced with a combinations of the pipeline recipe Esorex (versions 3.5.1 and 3.6.5) included in the pipeline provided by ESO, and a series of IDL and IRAF customized scripts. Esorex was initially used to perform the basic data reduction (bias subtraction, flat field correction, spectra tracing and extraction, correction of fiber and pixel transmission and relative flux calibration). Then, the four quadrants per pointing were reduced individually and combined into a single data-cube associated to each pointing. The final “super-cube” per object was generated combining the four independent dithered pointings, containing a total of 1936 spectra.
During the reduction process, we observed vertical patterns over the entire FOV in the cases of IRAS F10567-4310 and IRAS F17138-1017, which affected only the regions of the spectra with relatively low S/N. These patterns were still present after the flat field reduction. With the aim of correcting for this effect we tried to perform the flat-field correction with flat-field exposures taken on different observing nights. Unfortunately, this attempt failed and the vertical patterns are visible in the final data cubes of these two objects. On the other hand, the data cube of IRAS F12596-1529 showed “zig-zag” vertical patterns within a region to the east of the VIMOS FOV. In this case these vertical patterns are caused by an incorrect fiber tracing during the reduction process. With the aim of correcting for this effect we first used the approach of changing some of the input parameters of the recipe vmifucalib during the reduction, such as, for example, the “MaxTraceRejection” parameter, which sets the maximum percentage of rejected positions in fiber spectra tracing. In addition, we also ran the recipe vmifucalib with a fiber identification file and with the “blind” fiber identification method (i.e. without a fiber identification file). Finally we tried to create the final “super-cube” using three of the four independent dithered pointings, leaving out the pointing for which the presence of the patterns was more important. Unfortunately, none of these attempts was entirely successful and the best resulting reconstructed maps for this galaxy are shown in Fig. 1.
The wavelength calibration and the fiber-to-fiber transmission correction were checked using the [O I]λ6300.3 Å sky line. Because we are going to concentrate on a wavelength range around the Hα and the [N II]λλ6548.1, 6583.4 Å emission lines, the [O I]λ6300.3 Å sky line is suitable because of its proximity to these lines. In order to give an estimate of the absolute wavelength calibration accuracy and the spectral resolution for the sample as a whole, we first fitted the [O I]λ6300.3 Å sky line to a single Gaussian profile for all spectra of each individual source, obtaining a central wavelength and a FWHM value of the sky line for each object. Then, we calculated the mean of these values, obtaining representative values for the whole sample of 6300.29 ± 0.07 Å2 and 1.80 ± 0.07 Å. It is worth mentioning that the spectral resolution is fairly uniform over the entire FOV for all the objects in the sample. In addition, [O I]λ6300.3 Å flux values were also obtained from the fit. These values were used to derived and correct flat-field residuals affecting the fiber-to-fiber flux calibration.
Typical flux-percentage error, offset and C2 kpc values for the (U)LIRGs in the VIMOS
sample.
and C2 kpc values for the (U)LIRGs in the VIMOS
sample.
Because this study is focused on the ionized gas and stellar structure, it is important
to assess the uncertainty associated to the relative flux after the calibration. With that
in mind, we decided to perform the following test for all the galaxies in the sample. We
first measured for each spaxel and individual pointing the median of the flux within a
“clean” (i.e. with no emission/absorption lines) region of the continuum. We then
calculated the mean and the standard error of the mean (SE) for the values associated to
the four dither pointings. The SE was calculated assuming a normal distribution, i.e.
SE = σ/ ,
where σ and N are the standard deviation and the
sample size respectively. In this case N = 4, corresponding to the four
flux values considered. At this stage, we were able to associate a flux percentage error
to each point observed in the selected area. We define as the typical percentage error
associated to the flux for a certain object as the sum of all the flux percentage errors
obtained for each spaxel in the frame divided by the total number of spaxels considered
for the analysis (i.e. leaving out the bad spaxels).
,
where σ and N are the standard deviation and the
sample size respectively. In this case N = 4, corresponding to the four
flux values considered. At this stage, we were able to associate a flux percentage error
to each point observed in the selected area. We define as the typical percentage error
associated to the flux for a certain object as the sum of all the flux percentage errors
obtained for each spaxel in the frame divided by the total number of spaxels considered
for the analysis (i.e. leaving out the bad spaxels).
Column 2 in Table 2 presents the typical percentage errors for all galaxies in our sample. We find values ranging from of 3.7% in the case of IRAS F10015-0614, to 21% for IRAS F10038-3338, with a mean and a median value for the whole sample of 12% and 11% respectively. Figure 2 shows the outputs of the test for the particular case of IRAS 13229-2934 (NGC 5135). Figure 2a shows the ratio between the standard error of the mean (SE) and the mean value of the flux per spaxel plotted against the mean value of the flux per spaxel. Figure 2b is an histogram showing the flux percentage error distribution. Is obvious from this figure that the majority of the spaxels have a typical percentage error lower than 20%. We find that the typical error associated to the flux in this case is 9.8%.
The emission lines from each galaxy were analyzed by fitting them to Gaussian profiles with the MPFITEXPR code, which was implemented by Markwardt in the IDL environment3. This algorithm allows us to fix wavelength differences and line intensity ratios according to atomic parameters when adjusting multiple emission lines (e.g. the Hα-[n ii] complex). As a first approach, we fitted automatically all lines to single Gaussian profiles, which produced adequate fits in most cases. However, for certain regions of the galaxy, a multi-component fit with two or even three components per line was required in order to adequately fit the data. This was the case for 13 of the 38 sources included in this study. These multiple components are frequently concentrated in the nuclear regions of the galaxies and only extend few spaxels. The exceptions are IRAS F04315-0840, IRAS F14544-4255(E), and IRAS F23128-5919, where double components are visible extending over 12 kpc through the body of the galaxy. It is worth mentioning that the spatial identification of the different components can be done unambiguously because they usually have rather different kinematic properties. A detailed discussion of the properties of these secondary components is beyond the scope of this paper and will be addressed in future publications. For those cases with several kinematic distinct components, the Hα and the EW maps in Fig. 1 refer to the systemic component, which is usually extended over the entire body of the system. By default the same line width was considered for all lines of a spectrum. For each emission line we ended up with the following information: central wavelength, FWHM, and flux intensity. Finally, we used these magnitudes and the spatial position of each spaxel to generate an image (a map) that can be treated as a standard image of a galaxy.
3. The atlas of VIMOS continuum, Hα and Hα - EW maps
Figure 1 shows DSS or HST images (for the galaxies with HST images available in the archive), as well as the VIMOS images for all galaxies in our sample. The second panel shows the continuum images created by simulating a filter covering the spectral range 6390–6490 Å (rest frame). When generating these images, we selected a 2σ lower cut as a threshold to distinguish galaxy from background, where σ was the root mean square (rms) of the flux in a region of our FOV free from galaxy emission. The 2σ lower cut was selected based on a detailed comparison between the VIMOS continuum images and the corresponding DSS and/or HST images of the galaxies (i.e., after applying a 2σ lower cut to our VIMOS continuum images these adequately traced the structure observed in the SDSS and/or HST images).
The third panel in the figure shows the ionized gas emission from the galaxies, as traced by Hα. The lower limit for the Hα images was selected on the basis of the fit to the emission line. Only those regions were the S/N ratio was sufficiently high to perform the fit were used for the figure. The regions with negligible or no signal and some bad spaxels have been cleaned using either customized IDL routines or the routine IMEDIT in IRAF. In addition, the forth panel in Fig. 1 shows the Hα equivalent width (EW) in units of Angstroms.
As mentioned in Sect. 2.3, the data cubes of IRAS F10567-4310 and IRAS F17138-1017 showed vertical patterns over the entire FOV, which are only important if the S/N is low. Therefore, although they affect the morphology of the continuum (and the corresponding Hα − EW) images, they have no effect on the Hα emission maps shown in Fig. 1. On the other hand, the vertical patterns observed in the case of IRAS F12596-1529 are caused by an incorrect fiber tracing during the reduction process (see Sect. 2.3 for details), and affect both the continuum and the Hα images.
The continuum images mainly trace the stellar light from the galaxy, while the Hα images trace the star-formation activity, or the presence of ionizing shocks, or an AGN. In this context, Paper II shows that some of the objects in our sample have line ratios consistent with ionization by shocks, mainly concentrated in the extended regions (see the paper for details). However, the study presented in Paper II excludes the nuclear regions of the sources, which can be potentially contaminated by AGN emission. In order to give an idea of the importance of the AGN emission among the objects in our sample, Col. 9 in Table 1 shows the nuclear spectroscopic classification (when available) for the objects in our sample. As shown in the table, only ~17% of the objects in our sample with nuclear, optical spectroscopic classification (5 of 29) are classified as Seyfert galaxies, i.e. the AGN contributes significantly at optical wavelengths. In addition, one object is classified as LINER and five as ambiguous (HII/Sy, HII/LINER or HII/LINER/Sy). For these objects, the AGN contribution to the optical emission is less certain. Overall, ~66% of the objects in our sample with nuclear, spectroscopic classification in the optical (19 of 29) are classified as HII-like galaxies. Therefore, although AGN emission might still contribute to the optical light from these sources, their continuum and nuclear Hα emissions are dominated by stellar light and recent/ongoing star-formation activity respectively.
4. Morphology of the stellar and ionized gas emissions and EW(Hα) maps
The continuum and the Hα emission images show morphologies that are substantially different for the overwhelming majority of the sources. The Hα images usually reveal clumpy, extended structures that are not visible in the corresponding continuum images. For example, although ring structures are not observed in the continuum images, they are clearly visible in the Hα images for some LIRGs in our sample, such as IRAS F01159-4443S, IRAS F06076-2139, IRAS F11506-3851, IRAS F12043-3140S and IRAS F12115-4656. The presence of such rings for some of these LIRGs has already been reported in the past by other authors (e.g. Alonso-Herrero et al. 2002; Hattori et al. 2004; Rampazzo et al. 2005; Alonso-Herrero et al. 2006). These structures are usually relatively symmetric and centered on the nucleus of the systems. In most cases they are located in the circumnuclear region, although in the case of IRAS F11255-4120 the ring extends up to ~4 kpc away from the nucleus of the galaxy. In addition, the Hα images of some sources also show other extended tidal structures such as bridges (e.g. IRAS F01159-4443), tidal tails (e.g. IRAS F10409-4556) or spiral arms (e.g. F01341-3735N, IRAS F10567-4310, IRAS F21453-3511 or IRAS 07027-6011N), that extend up to few kpc (~3–4 kpc) from the nuclear region of the galaxy. Is also interesting IRAS F01341-3735S (ESO-297-G012), where the Hα emission extends along the galaxy minor axis. As suggested by Dopita et al. (2002), it is possible that in this galaxy the nuclear starburst is blowing out gas in the polar direction, similar to the case of M 82. Overall, the different morphologies between the stellar and ionized gas emission are explained in terms of bright, extranuclear star-formation activity along the tidal tails or the spiral arms and/or ionizing shocks in the extra-nuclear extended regions (Colina et al. 2005, Paper II, and references therein).
It is also interesting to study the morphology of the EW images shown in Fig. 2. In some cases, these images help to trace the extended structures seen in Hα emission. For example, a ring of star formation is inferred from the Hα image in the case of IRAS 12115-4656, but clearly emerges in the corresponding EW image of the galaxy. In general, these images often show regions with high (EW > 100 Å) values that are associated to the large-scale structures seen in the Hα images (e.g. IRAS F06035-7102, IRAS F11255-4120 or IRAS F21453-3511). In Paper II we carried out a study of the different ionization mechanisms for the LIRGs within our sample. We found log [NII]λ6583/Hα values substantially lower than − 0.2 in the majority of the cases, consistent with photoionzation by stars (see Paper II for details). Using the Leitherer et al. 1999, models for solar metalicity, instantaneous starburst and Salpeter 1955 IMF, these large EW values correspond to stellar ages of t ≲ 6 Myr.
4.1. Implications for long-slit spectroscopic studies
Up to date, most of the spectroscopic studies of LIRGs and ULIRGs have used long slit observations (e.g. Veilleux et al. 1999; Kewley et al. 2001; Corbett et al. 2003; Rodríguez Zaurín et al. 2009). In these studies, the position of the slit is usually selected to cover the brightest regions of the galaxies observed in continuum emission. However, as discussed before, the Hα morphologies are substantially different than those of the continuum for the majority of the objects in our sample.
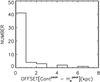 |
Fig. 3 Histograms showing the distribution of the offsets, in kpc, between the high surface brightness peak of continuum and the Hα emission for the objects shown in Fig. 1. |
Our IFS dataset allows us to investigate some caveats associated to long slit
spectroscopic studies. For example, positional uncertainties of the slit may lead to a
misclassification of the optical spectrum of the sources (e.g. Arribas et al. 2000). With that in mind, we first compare the location
of the surface brightness peaks in the continuum and the Hα maps. The
surface brightness peaks are determined using the IRAF routine
PHOT with a centroid algorithm, that determines the location of the
peaks computing the intensity weighted means of the marginal profiles
in x and y. Column 3 in Table 2 shows the offsets, in kpc, between the peaks of the continuum and the
Hα emission (offset ),
and Fig. 3 is an histogram showing the distribution
of such offsets. For the purpose of the figure the individual nuclei in double or triple
systems have been considered separately. The figure shows that for the majority of the
objects (41 of the 51 individual sources considered) the peaks of the stellar and the
ionized gas emissions are separated by less than 1 kpc. The median
offset
value for the whole sample is 0.2 kpc. Note that 10 sources (~20%) show peak
separations higher than 1 kpc. Some extreme cases are the LIRG IC 564 and the ULIRG
IRAS 21130-4446. The former has the peak of the Hα emission
~6 kpc to the east from peak of the continuum emission. In the case of
IRAS 21130-4446, the peak of the continuum is located to the north of the system, while
the maximum Hα emission is shifted ~4 kpc towards the south,
coinciding with the central region of the system.
),
and Fig. 3 is an histogram showing the distribution
of such offsets. For the purpose of the figure the individual nuclei in double or triple
systems have been considered separately. The figure shows that for the majority of the
objects (41 of the 51 individual sources considered) the peaks of the stellar and the
ionized gas emissions are separated by less than 1 kpc. The median
offset
value for the whole sample is 0.2 kpc. Note that 10 sources (~20%) show peak
separations higher than 1 kpc. Some extreme cases are the LIRG IC 564 and the ULIRG
IRAS 21130-4446. The former has the peak of the Hα emission
~6 kpc to the east from peak of the continuum emission. In the case of
IRAS 21130-4446, the peak of the continuum is located to the north of the system, while
the maximum Hα emission is shifted ~4 kpc towards the south,
coinciding with the central region of the system.
In addition, we can also estimate the amount of flux that falls outside the slit for the typical slit-width values used in previous long-slit studies. With that in mind we used our Hα images and simulated a slit of a width of 2 arcsec at parallactic angles (PA) 0° and 90°, crossing the galaxy through its center, defined as the peak of the continuum emission. The fraction of the observed Hα flux within the slit is shown for each galaxy in Col. (3) in Table 3. For those objects with double nucleus structure, for which is not possible to study the individual sources separately (e.g. IRAS F06035-7102), the slit is centered on the brightest nucleus in the continuum. If we concentrate in the slit PA that includes the larger fraction of the observed Hα emission for each galaxy, we find that the percentage of the flux outside the slit is in the range 17–90%, with mean and median values of 59% and 61%.
This result is important when addressing the long-standing issue of whether or not optical observations can penetrate to the main power source of the IR luminosity. If we aim to compare, for example the star-formation rates (SFRs) obtained using the Hα and IRAS IR luminosities, our results suggest that using the Hα luminosities derived from long-slit studies would substantially underestimate the value of the optical SFRs. We will come back to this in the following section.
Hα flux emission and derived quantities for the (U)LIRGs in the VIMOS sample.
4.2. The concentration of the continuum and the Hα emissions
With the aim of further investigating the morphologies of the images shown in Fig. 2 we defined the parameter
C2 kpc as the ratio of the flux contained within an
aperture of 2 kpc diameter centered on the nucleus of the object, and the total flux from
the galaxy within the same physical region for all the galaxies in our sample
(6 kpc × 6 kpc):  (1)The objects in our sample
expand over a wide range of redshifts, and therefore, the physical scale covered by the
27 arcsec × 27 arcsec VIMOS FOV can be substantially different from one object to
another. In order to avoid possible biases in our results caused by such an effect, we
measured C2 kpc within the same physical region for all the
objects in our sample used for this study. We selected a region of 6 kpc × 6 kpc, which
is the FOV of IRAS F10257-4339 and the minimum FOV covered among the objects in our
sample. The C2 kpc values for the continuum
(
(1)The objects in our sample
expand over a wide range of redshifts, and therefore, the physical scale covered by the
27 arcsec × 27 arcsec VIMOS FOV can be substantially different from one object to
another. In order to avoid possible biases in our results caused by such an effect, we
measured C2 kpc within the same physical region for all the
objects in our sample used for this study. We selected a region of 6 kpc × 6 kpc, which
is the FOV of IRAS F10257-4339 and the minimum FOV covered among the objects in our
sample. The C2 kpc values for the continuum
( ) and the
Hα (
) and the
Hα ( )
images using a physical region of 6 kpc × 6 kpc are shown in Cols. 4 and 5 in
Table 3 and used for Figs. 4 and 5. However, for some of the
more distant and extended galaxies, a 6 kpc × 6 kpc region covers a small fraction of
the total extension from the galaxy within our VIMOS FOV. Therefore, with the aim of using
the full information within our dataset we also measured
C2 kpc using the total,integrated flux within the entire
VIMOS FOV:
)
images using a physical region of 6 kpc × 6 kpc are shown in Cols. 4 and 5 in
Table 3 and used for Figs. 4 and 5. However, for some of the
more distant and extended galaxies, a 6 kpc × 6 kpc region covers a small fraction of
the total extension from the galaxy within our VIMOS FOV. Therefore, with the aim of using
the full information within our dataset we also measured
C2 kpc using the total,integrated flux within the entire
VIMOS FOV: 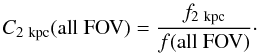 (2)The results are
shown in Cols. 6 and 7 in Table 2. As seen in
Fig. 1, the extended emission for an important
fraction of our objects (~65%) is not entirely covered by the entire VIMOS FOV.
Therefore, even the C2 kpc values obtained using the VIMOS
FOV are, in general, upper limits. On the other hand, because we have not corrected for
reddening effects, if the extinction is much higher on the nuclear regions than in the
external regions, C2 kpc would be lower limits.
(2)The results are
shown in Cols. 6 and 7 in Table 2. As seen in
Fig. 1, the extended emission for an important
fraction of our objects (~65%) is not entirely covered by the entire VIMOS FOV.
Therefore, even the C2 kpc values obtained using the VIMOS
FOV are, in general, upper limits. On the other hand, because we have not corrected for
reddening effects, if the extinction is much higher on the nuclear regions than in the
external regions, C2 kpc would be lower limits.
The two nuclei of IRAS 08424-3130 and the brighter, western source of IRAS F12596-1529
fall close to the edges of the VIMOS images and it is not possible to measure the flux
within an aperture of 2 kpc in diameter. In addition, in the case of IC 564 (the northern
galaxy of the double system IRAS F09437 + 0317), two pointings were used during the
observations of this galaxy. Therefore, it is not possible to adequately estimate
C2 kpc. No values for the continuum and the
Hα images are presented for these three objects in the table. On the
other hand, the low S/N of the IRAS F01159-443 and
IRAS F06295-1735 continuum images, the vertical patterns in the cases of IRAS F10567-4310
and IRAS F17138-1017 and important contamination by stars in the field in the case of
IRAS F18093-5744 prevents any attempt to measure for these
five sources.
Note that for some objects that are morphologically classified as 1 (interacting galaxies), it is not possible to infer C2 kpc for the individual sources separately. Then the C2 kpc values presented in the table are obtained centering the 2 kpc aperture on the brightest nucleus in the continuum. These sources are the LIRGs IRAS F01159-4443, IRAS F06076-2139 and IRAS F08520-6850 and the ULIRGs 06035-7102, IRAS F06206-2139, IRAS F22491-1808 and IRAS F23128-5919. Although the 2 kpc aperture is centered on the brightest nucleus, a substantial fraction of the emission from these systems still falls outside the aperture, more so for the ULIRGs. Possible biases in the general results owing to this effect will be discussed below.
 |
Fig. 4 Ratio between the concentration C2 kpc for the Hα and the continuum emission plotted against the log of the infrared luminosity LIR. Note that there are three points with LIR < 1011 L⊙. These are IRAS F01341-3735N (ESO-297-G011), IRAS F09437-0317S (IC 563) and IRAS F18093-5744S (IC 4689). For these multiple systems at least one of the individual galaxies falls outside the LIRG luminosity range. The points are labeled on the basis of our morphological classification. Type 0: blue squares. Type 1: black stars. Type 2: red circles. |
In the first place, we compared the values obtained for the continuum and the
Hα images. Figure 4 shows the
ratio between  and
. For
IRAS F01341-3735, IRAS F09437-0317 and IRAS F18093-5744, the entire system has a
LIR > 1011 L⊙.
However, the results of Surace et al. (2004) show
that at least one of the individual galaxies of these multiple nuclei systems falls
outside the LIRG luminosity range, and therefore, there are points in the figure below the
LIRG threshold
(log (LIR/L⊙) = 11). Figure 4 shows that the fraction of the
Hα emission from the central 2 kpc is higher than that of the continuum
for 85% of the sources used for the figure (33 of 39). The
values are
in the range of 0.11–0.54 with a median value of 0.27, while values in the range of
0.11–0.81 are found for ,
with a median value of 0.39. The six objects with / values lower
than 1.0 are IRAS F07027-6011N, IRAS F09437-0317S, IRAS F10015-0614, IRAS F10409-4556,
IRAS F11506-3851 and IRAS F22132-3705. Interestingly, the majority of these sources show
Hα morphologies that are substantially different from those of the
continuum. For example, the Hα image of IRAS F07027-6011N shows a chain
of knots embedded within the main body of the galaxy that is separated ~3 kpc
from the nucleus and extends towards the southwest of the galaxy. Comments on this and the
other sources can be found in appendix A.
and
. For
IRAS F01341-3735, IRAS F09437-0317 and IRAS F18093-5744, the entire system has a
LIR > 1011 L⊙.
However, the results of Surace et al. (2004) show
that at least one of the individual galaxies of these multiple nuclei systems falls
outside the LIRG luminosity range, and therefore, there are points in the figure below the
LIRG threshold
(log (LIR/L⊙) = 11). Figure 4 shows that the fraction of the
Hα emission from the central 2 kpc is higher than that of the continuum
for 85% of the sources used for the figure (33 of 39). The
values are
in the range of 0.11–0.54 with a median value of 0.27, while values in the range of
0.11–0.81 are found for ,
with a median value of 0.39. The six objects with / values lower
than 1.0 are IRAS F07027-6011N, IRAS F09437-0317S, IRAS F10015-0614, IRAS F10409-4556,
IRAS F11506-3851 and IRAS F22132-3705. Interestingly, the majority of these sources show
Hα morphologies that are substantially different from those of the
continuum. For example, the Hα image of IRAS F07027-6011N shows a chain
of knots embedded within the main body of the galaxy that is separated ~3 kpc
from the nucleus and extends towards the southwest of the galaxy. Comments on this and the
other sources can be found in appendix A.
On the other hand, note that ~52% of the individual sources used for this study (23 of 37) have more than half of their Hα emission outside the central 2 kpc (this becomes 62% when using the entire VIMOS FOV). In principle, this result emphasizes the importance of the extended star-formation activity in (U)LIRGs (see also Alonso-Herrero et al. 2006; García-Marín et al. 2009b,a). However, it is worth mentioning that we have not corrected for reddening effects, which are usually more important towards the nuclear regions of these objects. Because reddening effects are expected to be important for objects such as LIRGs and ULIRGs, it is likely that the fraction of the Hα emission within the central 2 kpc of the sources is, once corrected for extinction, larger than the values shown in Table 2. Indeed, ground-based mid-IR studies, which are less affected by extinction, indicate that at least in ULIRGs without evidence for an AGN, the star formation activity is concentrated within the central kpc (Soifer et al. 2000, 2001), while in a large fraction of LIRGs, the MIR emission appears to be extended over a few kpc (Díaz-Santos et al. 2008)
4.3. C vs. the infrared luminosity and the morphological class
We investigate in this section whether the more luminous objects have the star-formation
activity more concentrated towards the nuclear regions. Figure 5 shows
plotted against the log of infrared luminosity of the sources
(LIR). The open stars correspond to those objects
morphologically classified as 1, for which is not possible to infer
separately for the individual sources. Note that the four ULIRGs in our sample classified
as 1, located in the bottom right of the figure, fall within this group. As described
before, in these cases we center the 2 kpc aperture on the brightest nucleus, but most of
the emission still falls outside the aperture. If we concentrate in the figure on the
individual sources, no clear evidence for the presence of correlations between
and
LIR is found. The same conclusion is reached when using the
obtained using the entire VIMOS FOV.
 |
Fig. 5 Concentration
|

 |
Fig. 6 Reddening coefficient E(B − V) for those objects with nuclear spectroscopic data available in the literature, plotted against the IR luminosities of the sources. See Sect. 5 for details on how the E(B − V) were calculated. The bar in the bottom-right of the plot represents the error associated with the E(B − V) values. |
A possible explanation for this apparent lack of correlations are extinction effects. It is possible that for objects with higher LIR the star-formation activity is indeed more concentrated in the nuclear regions. However, it is likely that they also have higher amounts of dust at these locations and that therefore the fraction of the observed Hα flux within the central 2 kpc is not significantly higher than that of objects with lower infrared luminosities. In this context, Fig. 6 shows the E(B − V) values for those objects for which nuclear spectroscopic data are available in the literature (see Sect. 5 for details), plotted against the IR luminosities of the sources. Although with some scatter, the results shown in the figure suggest that objects with higher luminosities tend to have higher nuclear E(B − V) values. The mean and median E(B − V) values for the LIRGs in our sample are 0.83 and 0.86, while these values are 1.24 and 1.08 for the ULIRGs.
To further look for the presence of trends, we calculated the
median
values for the different morphological classes. We find values of 0.37, 0.50 and 0.53 for
objects classified as 0, 1, and 2 respectively (these values are 0.25, 0.39 and 0.51 when
using the
values, in Col. 6 and 7 in Table 2). The seven
objects for which it is not possible to estimate for
the individual sources separately, and those with a controversial morphological
classification have not been used when calculating these numbers. These results suggest
that the Hα emission from objects classified as 1 and 2 is
more compact than for objects classified as 0. However, as seen in Fig. 5, where the points are labeled based on the different
morphological classes, there is a large scatter associated with the values of
.
Samples with a larger number of objects of each different morphological class are required
to confirm this result.
Consistent with previous studies we find substantial, extended star-formation activity in objects without evidence of strong past or ongoing interaction (e.g. Hattori et al. 2004; Alonso-Herrero et al. 2006, 2009). Indeed, Hattori et al. (2004) found that the majority of the objects in their sample with most of the Hα emission in the extended regions were single objects. It is possible that these objects have undergone some kind of perturbance in the past (e.g. minor merger). We are currently carrying out a 2D kinematic study of the galaxies in our sample that will help to investigate this possibility.
5. The Hα emission as a tracer of star formation
In this section we compare the ionized gas and the IR emissions as indicators of the star-formation activity. Column (2) in Table 3 shows the values of the Hα flux obtained for all galaxies in our sample. All objects except for IRAS F06035-7102, IRAS F09437+0317(IC 563), and IRAS F10038-3338 were observed under photometric conditions, as observed in the Paranal-LOSSAM (Line of Sight Sky Absorption Monitor), which is used to determine the sky conditions, i.e. photometric, cloudy, or overcast4. For completeness, the values of the Hα flux for these objects are shown in the table, although they are not used for the analysis presented in this section. The values presented in the table were corrected for Galactic reddening using the Howarth (1983) extension to optical wavelengths of the Seaton (1979) reddening law, along with the E(B − V) values derived from the far-IR based maps of extinction by Schlegel et al. (1998). The estimated uncertainty for the absolute fluxes presented in the table is ≲ 20%. This value was estimated by comparing the response curves of the standard stars observed during each of the three observing periods. Then we calculated the “mean response curve” and the standard deviation from this curve for each individual standard star. The response curves are within an uncertainty of 20% of the mean through the entire useful wavelength range for all the standard stars observed.
As a first approach we compare the SFRs obtained using the Hα luminosities
(SFRHα), without reddening correction, and the IR
luminosities (SFRIR) of the sources. To calculate these values we used the
calibration by Kennicutt
(1998) (3)
(3) (4)where
LIR is the IR luminosity integrated over the range
8–1000 μm. Figure 7 shows the log of
SFRHα plotted against the log of SFRIR. For the
figure we also used the results of García-Marín et al.
(2009a), based on optical integral field spectroscopic observations of a sample of
22 ULIRGs. The circles in the figure correspond to the objects in our sample, while stars
correspond to objects in the García-Marín et al.
(2009a) sample. Consistent with the results of Dopita et al. (2002), the figure shows that the SFRs derived using the reddened
LHα substantially underpredict those obtained
using LIR. We find mean and median values for the ratio
SFRHα/SFRIR of 0.08 and 0.06 respectively. In
addition, objects classified as Sy galaxies are indicated in the figure with open symbols.
The figure shows that with the exception of IRAS F05189-2524, the few objects classified as
Sy galaxies do not stand out from the others in the plot.
(4)where
LIR is the IR luminosity integrated over the range
8–1000 μm. Figure 7 shows the log of
SFRHα plotted against the log of SFRIR. For the
figure we also used the results of García-Marín et al.
(2009a), based on optical integral field spectroscopic observations of a sample of
22 ULIRGs. The circles in the figure correspond to the objects in our sample, while stars
correspond to objects in the García-Marín et al.
(2009a) sample. Consistent with the results of Dopita et al. (2002), the figure shows that the SFRs derived using the reddened
LHα substantially underpredict those obtained
using LIR. We find mean and median values for the ratio
SFRHα/SFRIR of 0.08 and 0.06 respectively. In
addition, objects classified as Sy galaxies are indicated in the figure with open symbols.
The figure shows that with the exception of IRAS F05189-2524, the few objects classified as
Sy galaxies do not stand out from the others in the plot.
 |
Fig. 7 Log of the star-formation rates (SFR) in M⊙ yr-1 derived using the the Hα luminosity (SFRHα), without reddening correction, plotted against the log of the SFR obtained using the IR luminosities. We used the results of García-Marín et al. (2009a) for the figure from their sample of ULIRGs. The circles correspond to the objects in our sample, while stars correspond to objects in García-Marín et al. (2009a) sample. Those objects classified as Sy galaxies are indicated in the figure with open symbols. |
The results shown in Fig. 7 were, a priori, expected because objects such as LIRGs and ULIRGs are known to suffer severe extinction effects. In order to correct for these effects, we first estimated the reddening factor E(B − V). For this purpose, we used he Hα/Hβ values available in the literature, along with the interstellar extinction law based on Savage & Mathis (1979). We assumed an intrinsic Hα/Hβ ratio of 2.85 for HII galaxies (typical for Case B recombination decrement for Te ~ 104 K and Ne ~ 104 cm-3) and 3.10 for AGN (Ferland & Netzer 1983). Column 4 in Table 3 shows the measured E(B − V) values.
Note that the E(B − V) values shown in
Table 3 have been calculated using the
Hα/Hβ ratios from the literature, which are based on
long-slit spectroscopic observations. These observations usually concentrate on the nuclear
regions of the objects. However, reddening effects are more important in the nuclear
regions, and decrease significantly towards the extended regions of the objects (García-Marín et al. 2009a). Therefore, to correct for
reddening effects, we have used the “nuclear”
E(B − V) values in Table 3 to deredden only the fraction of the
Hα emission within a slit of 2 arcsec width (typical slit width), which
was estimated in the previous section and shown in Table 3. As described in that section, a slit PAs 0° and 90° was used for each galaxy.
When correcting from reddening, the slit PAs that include the larger fraction of the
observed Hα emission were used. To deredden the Hα fluxes
we used the standard expression  (5)where
Fi and Fo are the intrinsic and
the observed flux respectively, and f(λ) is the reddening
law. The total observed Hα emission for the galaxies is calculated as the
sum of the reddening-corrected Hα emission within the slit plus the
Hα emission outside the slit, not corrected for reddening. Although less
important than in the nuclear regions, reddening effects are also present in the extended
regions of the objects (Alonso-Herrero et al. 2009).
Therefore, this approach will tend to underestimate the values of the dereddened
SFRHα. However, since the reddening in the extended regions
is usually substantially smaller than in the nuclear regions (García-Marín et al. 2009a; Alonso-Herrero
et al. 2009), this underprediction is not expected to significantly affect the
conclusions reached in this section.
(5)where
Fi and Fo are the intrinsic and
the observed flux respectively, and f(λ) is the reddening
law. The total observed Hα emission for the galaxies is calculated as the
sum of the reddening-corrected Hα emission within the slit plus the
Hα emission outside the slit, not corrected for reddening. Although less
important than in the nuclear regions, reddening effects are also present in the extended
regions of the objects (Alonso-Herrero et al. 2009).
Therefore, this approach will tend to underestimate the values of the dereddened
SFRHα. However, since the reddening in the extended regions
is usually substantially smaller than in the nuclear regions (García-Marín et al. 2009a; Alonso-Herrero
et al. 2009), this underprediction is not expected to significantly affect the
conclusions reached in this section.
 |
Fig. 8 Same as Fig. 7, but the Hα luminosity has been corrected from reddening effects. The nuclear E(B − V) values shown in Table 3 have been used for the objects in our sample (see text for details). On the other hand, a 2D reddening correction was applied for the ULIRGS in the García-Marín et al. (2009a) sample. The AGN dominated source IRAS F05189-2524 and all the objects in our sample with unavailable Hα/Hβ values are not used for the plot. |
The log of the reddening-corrected SFRHα plotted against the log of the SFRIR is presented in Fig. 8, together with the results of García-Marín et al. (2009a) for their sample of ULIRGs. The AGN-dominated source IRAS F05189-2524 and those objects with unavailable Hα/Hβ values have been left out of the plot. The García-Marín et al. (2009a) IFS observations cover the Hα – Hβ spectral range, and therefore, they were able to perform a detailed 2D reddening correction of the Hα emission from the galaxies in their sample. As is obvious from the figure, the correlation certainly improves. However, all the points in the figure still fall below the dashed line. After accounting for reddening effects, the mean and median values of the ratio SFRHα/SFRIR are 0.27 and 0.22. Overall, we conclude that the SFRs derived using the dereddened LHα generally underpredict those obtained using LIR by a factor of 4–5, indepently of the LIR of the sources. At this stage it is important to mention that the reddening correction described in this section accounts only for foreground screen extinction and regions that are not completely optically thick. “Internal” extinction (i.e. dust in the photoionized nebula) or heavily obscured regions that are only visible in the far-IR are not taken into account when applying a reddening correction based on the Hα/Hβ ratio. This would explain the lower values of SFRHα compared to those of SFRIR even after correcting for reddening effects.
6. Summary and conclusions
We presented a catalogue of the VIMOS continuum, Hα and Hα equivalent widths (EW) images of a sample of 31 LIRGs and 7 ULIRGs (a total of 47 individual galaxies). The continuum images trace the stellar emission, while the Hα images trace the ongoing star-formation activity and/or ionizing shocks. We performed a morphological study of the continuum and Hα images and compared the Hα and the IR luminosities as tracers of the star-formation activity. The main results are summarized as follows:
-
The morphologies of the continuum, Hα and EW images: the morphologies of the Hα images are substantially different from those of the continuum images. The Hα images frequently reveal clumpy structures, such as HII regions in spiral arms, tidal tails, rings, bridges, extended up to few kpc from the nuclear regions that are not visible in the continuum. The different morphologies are explained in terms of bright, extranuclear star-formation activity along the tidal tails or the spiral arms and/or ionizing shocks in the extra-nuclear extended regions (Colina et al. 2005; Monreal-Ibero et al. 2010, and references therein). We also compared the location of the surface brightness peaks in the continuum and the Hα images. For the majority of the objects in our sample (~80%) the peaks of the stellar and the ionized gas emissions are separated by less than 1 kpc, with a median value of 0.2 kpc for the whole sample.
-
The concentration of the continuum and the ionized gas emissions and their connection with the dynamical status of the objects: we investigated the morphologies of the images on the basis of the concentration of the emission C2 kpc, defined as the ratio of the flux contained within an aperture of 2 kpc of diameter centered on the nucleus of the object, and the observed flux from the galaxy within the same physical scale for all galaxies in our sample. In the first place, we find that the fraction of the observed Hα emission from the central 2 kpc is higher than that of the continuum for the majority (85%) of the sources used for the study presented here. If we concentrate on the Hα images, it is remarkable that 62% of the objects in our sample have more than the half of their observed Hα emission (not corrected from extinction) outside the central 2 kpc. This result further emphasizes the importance of the extended star-formation activity in (U)LIRGs. On the other hand, we do not find clear evidence for a correlation between C2 kpc and the IR luminosity of the sources. A possible explanation for this apparent lack of correlations are reddening effects. It is possible that objects with higher L(IR) have the star formation more concentrated towards the nuclear region. However, it is likely that they also have higher dust concentrations towards these regions and therefore, the Hα emission measured in the central 2 kpc is not significantly higher than in objects with lower luminosities. Finally, our results suggests that the star-formation activity is more concentrated in objects classified as 1 or 2 than in those classified as 0. However, samples with a greater number of objects of each morhological class are required to confirm these result.
-
The Hα emission as a tracer of the star formation: we find that the SFRs derived using the Hα luminosities generally underpredict those obtained using the MFIR luminosities, even after correcting from reddening effects.
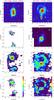 |
Fig. 1 Top panel: DSS image of the galaxy. For those objects for which HST images are available in the literature these are used for the figure. The exceptions are IRAS F13229-2934 and IRAS F21453-3511. For these galaxies the HST image does not cover the entire emission from the galaxies and we prefered to use the DSS images. The box on the DSS or HST images indicates the VIMOS field of view, while the horizontal line in the bottom left of the same images corresponds to a scale of 10 kpc. Second panel: the continuum within the wavelength range 6390–6490 Å (rest frame). Third panel: the Hα emission from the galaxy. Both the continuum and the Hα maps are represented in logarithmic scale, and in arbitrary flux units. Fourth panel: Hα equivalent width (Hα − EW) in Å. With the exception of IRAS F10567-4310 and IRAS F17138-1017, the peak of the continuum emission, identified as the nucleus of the galaxy, is indicated in all the maps with a “plus” sign. For these two galaxies the morphology of the continuum is less constrained because of the presence of vertical patterns (see text for details). In these cases the “plus” sign corresponds to the location of the peak of the Hα emission. Note that two pointings were used to cover the full emission from the galaxy IRAS F09437+0317N (IC 564), which are referred to in the figure as N(P1) and N(P2). |
 |
Fig. 1 continued. |
 |
Fig. 1 continued. |
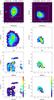 |
Fig. 1 continued. |
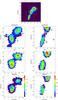 |
Fig. 1 continued. |
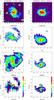 |
Fig. 1 continued. |
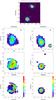 |
Fig. 1 continued. |
 |
Fig. 1 continued. |
 |
Fig. 1 continued. |
 |
Fig. 1 continued. |
 |
Fig. 1 continued. |
 |
Fig. 1 continued. |
 |
Fig. 1 continued. |
 |
Fig. 1 continued. |
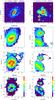 |
Fig. 1 continued. |
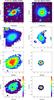 |
Fig. 1 continued. |
 |
Fig. 1 continued. |
 |
Fig. 1 continued. |
 |
Fig. 1 continued. |
 |
Fig. 1 continued. |
 |
Fig. 1 continued. |
 |
Fig. 1 continued. |
 |
Fig. 1 continued. |
http://archive.stsci.edu/dss (DSS) images, which are available for all the sources in our sample, along with the HST images in the archive for the 21 of the sources for which these images are available.
This is in good agreement with its actual value (6300.304 Å Osterbrock et al. 1996).
Available at http://purl.com/net/mpfit
Acknowledgments
We thank Macarena García Marín for her help during the early stages of this project. We also thank the anonimous referee for useful comments that helped to greatly improve the paper. Based on observations carried out at the European Southern observatory, Paranal (Chile), Programs 076.B-0479(A), 078.B-0072(A) and 081.B-0108(A). We thank Edward L. Wright for the Wright (2006) cosmology calculator. This paper uses the plotting package jmaplot developed by Jesús Maíz Apellániz, http://dae45.iaa.csic.es:8080/~jmaiz/software. This research made use of the NASA/IPAC Extragalactic Database (NED), which is operated by the Jet Propulsion Laboratory, California Institute of Technology, under contract with the National Aeronautics and Space Administration. The Digitized Sky Surveys were produced at the Space Telescope Science Institute under U.S. Government grant NAG W-2166. The images of these surveys are based on photographic data obtained using the Oschin Schmidt Telescope on Palomar Mountain and the UK Schmidt Telescope. The plates were processed into the present compressed digital form with the permission of these institutions. This work has been supported by the Spanish Ministry of Science and Innovation (MICINN) under grant ESP2007-65475-C02-01. AM-I is supported by the Spanish Ministry of Science and Innovation (MICINN) under program “Specialization in International Organisms”, Ref. ES2006-0003.
References
- Alonso-Herrero, A., Engelbracht, C. W., Rieke, M. J., Rieke, G. H., & Quillen, A. C. 2001, ApJ, 546, 952 [NASA ADS] [CrossRef] [Google Scholar]
- Alonso-Herrero, A., Rieke, G. H., Rieke, M. J., & Scoville, N. Z. 2002, AJ, 124, 166 [NASA ADS] [CrossRef] [Google Scholar]
- Alonso-Herrero, A., Rieke, G. H., Rieke, M. J., et al. 2006, ApJ, 650, 835 [NASA ADS] [CrossRef] [Google Scholar]
- Alonso-Herrero, A., García-Marín, M., Monreal-Ibero, A., et al. 2009, A&A, 506, 1541 [NASA ADS] [CrossRef] [EDP Sciences] [Google Scholar]
- Armus, L., Charmandaris, V., Bernard-Salas, J., et al. 2007, ApJ, 656, 148 [NASA ADS] [CrossRef] [Google Scholar]
- Arp, H. C., & Madore, B. F. 1987, A Catalogue of Southern Peculiar Galaxies and Associations 2 volume set, ed. B. F. Arp, & H. C. Madore [Google Scholar]
- Arribas, S., Carter, D., Cavaller, L., et al. 1998, ed. S. D’Odorico, SPIE Conf. Ser., 3355, 821 [NASA ADS] [CrossRef] [Google Scholar]
- Arribas, S., Colina, L., & Borne, K. 2000, ApJ, 542, 228 [NASA ADS] [CrossRef] [Google Scholar]
- Arribas, S., Colina, L., & Clements, D. 2001, ApJ, 560, 160 [NASA ADS] [CrossRef] [Google Scholar]
- Arribas, S., Colina, L., Monreal-Ibero, A., et al. 2008, A&A, 479, 687 [NASA ADS] [CrossRef] [EDP Sciences] [Google Scholar]
- Austermann, J. E., Aretxaga, I., Hughes, D. H., et al. 2009, MNRAS, 393, 1573 [NASA ADS] [CrossRef] [Google Scholar]
- Bastian, N., & Goodwin, S. 2006, MNRAS, 369, L9 [NASA ADS] [CrossRef] [Google Scholar]
- Bedregal, A. G., Colina, L., Alonso-Herrero, A., & Arribas, S. 2009, ApJ, 698, 1852 [NASA ADS] [CrossRef] [Google Scholar]
- Bendo, G. J., & Barnes, J. E. 2000, MNRAS, 316, 315 [NASA ADS] [CrossRef] [Google Scholar]
- Bonnet, H., Conzelmann, R., Delabre, B., et al. 2004, in SPIE Conf. Ser. 5490, ed. D. Bonaccini Calia, B. L. Ellerbroek, & R. Ragazzoni, 130 [Google Scholar]
- Chamaraux, P., Masnou, J., Kazés, I., et al. 1999, MNRAS, 307, 236 [NASA ADS] [CrossRef] [Google Scholar]
- Clements, D. L., Dunne, L., & Eales, S. 2010, MNRAS, 403, 274 [NASA ADS] [CrossRef] [Google Scholar]
- Colina, L., Arribas, S., & Borne, K. D. 1999, ApJ, 527, L13 [NASA ADS] [CrossRef] [PubMed] [Google Scholar]
- Colina, L., Arribas, S., & Monreal-Ibero, A. 2005, ApJ, 621, 725 [NASA ADS] [CrossRef] [Google Scholar]
- Condon, J. J., Helou, G., Sanders, D. B., & Soifer, B. T. 1996, ApJS, 103, 81 [NASA ADS] [CrossRef] [Google Scholar]
- Conselice, C. J., Blackburne, J. A., & Papovich, C. 2005, ApJ, 620, 564 [NASA ADS] [CrossRef] [Google Scholar]
- Coppin, K., Chapin, E. L., Mortier, A. M. J., et al. 2006, MNRAS, 372, 1621 [NASA ADS] [CrossRef] [Google Scholar]
- Corbett, E. A., Kewley, L., Appleton, P. N., et al. 2003, ApJ, 583, 670 [NASA ADS] [CrossRef] [Google Scholar]
- da Costa, L. N., Pellegrini, P. S., Davis, M., et al. 1991, ApJS, 75, 935 [NASA ADS] [CrossRef] [Google Scholar]
- Dasyra, K., Tacconi, L., Davies, R., et al. 2006, ApJ, 638, 745 [NASA ADS] [CrossRef] [Google Scholar]
- de Vaucouleurs, G., de Vaucouleurs, A., & Corwin, Jr., H. G. 1976, Second reference catalogue of bright galaxies, containing information on 4364 galaxies with references to papers published between 1964 and 1975, ed. G. de Vaucouleurs, A. de Vaucouleurs, & H. G. Jr. Corwin [Google Scholar]
- de Vaucouleurs, G., de Vaucouleurs, A., Corwin, Jr., H. G., et al. 1991, Third Reference Catalogue of Bright Galaxies, ed. G. de Vaucouleurs, A. de Vaucouleurs, H. G. Jr. Corwin, R. J. Buta, G. Paturel, & P. Fouque [Google Scholar]
- Díaz-Santos, T., Alonso-Herrero, A., Colina, L., et al. 2008, ApJ, 685, 211 [NASA ADS] [CrossRef] [Google Scholar]
- Dopita, M. A., Pereira, M., Kewley, L. J., & Capaccioli, M. 2002, ApJS, 143, 47 [NASA ADS] [CrossRef] [Google Scholar]
- Duc, P.-A., Mirabel, I. F., & Maza, J. 1997, A&AS, 124, 533 [NASA ADS] [CrossRef] [EDP Sciences] [Google Scholar]
- Farrah, D., Afonso, J., Efstathiou, A., et al. 2003, MNRAS, 343, 585 [NASA ADS] [CrossRef] [Google Scholar]
- Farrah, D., Weedman, D., Lonsdale, C. J., et al. 2009, ApJ, 696, 2044 [NASA ADS] [CrossRef] [Google Scholar]
- Ferland, G. J., & Netzer, H. 1983, ApJ, 264, 105 [NASA ADS] [CrossRef] [Google Scholar]
- Fiolet, N., Omont, A., Polletta, M., et al. 2009, A&A, 508, 117 [NASA ADS] [CrossRef] [EDP Sciences] [Google Scholar]
- García-Marín, M., Colina, L., Arribas, S., Alonso-Herrero, A., & Mediavilla, E. 2006, ApJ, 650, 850 [NASA ADS] [CrossRef] [Google Scholar]
- García-Marín, M., Colina, L., & Arribas, S. 2009a, A&A, 505, 1017 [NASA ADS] [CrossRef] [EDP Sciences] [Google Scholar]
- García-Marín, M., Colina, L., Arribas, S., & Monreal-Ibero, A. 2009b, A&A, 505, 1319 [NASA ADS] [CrossRef] [EDP Sciences] [Google Scholar]
- Genzel, R., Lutz, D., Sturm, E., et al. 1998, ApJ, 498, 579 [NASA ADS] [CrossRef] [Google Scholar]
- Hattori, T., Yoshida, M., Ohtani, H., et al. 2004, AJ, 127, 736 [NASA ADS] [CrossRef] [Google Scholar]
- Howarth, I. 1983, MNRAS, 203, 301 [NASA ADS] [CrossRef] [Google Scholar]
- Huchra, J., Davis, M., Latham, D., & Tonry, J. 1983, ApJS, 52, 89 [NASA ADS] [CrossRef] [Google Scholar]
- Huchra, J. P., Geller, M. J., Clemens, C. M., Tokarz, S. P., & Michel, A. 1992, Bulletin d’Information du Centre de Donnees Stellaires, 41, 31 [Google Scholar]
- Hughes, D. H., Serjeant, S., Dunlop, J., et al. 1998, Nature, 394, 241 [NASA ADS] [CrossRef] [Google Scholar]
- Hwang, H. S., Serjeant, S., Lee, M. G., Lee, K. H., & White, G. J. 2007, MNRAS, 375, 115 [NASA ADS] [CrossRef] [Google Scholar]
- Imanishi, M., Dudley, C., Maiolino, R., et al. 2007, ApJ, 171, 72 [Google Scholar]
- Jones, D. H., Read, M. A., Saunders, W., et al. 2009, MNRAS, 399, 683 [NASA ADS] [CrossRef] [Google Scholar]
- Kaldare, R., Colless, M., Raychaudhury, S., & Peterson, B. A. 2003, MNRAS, 339, 652 [NASA ADS] [CrossRef] [Google Scholar]
- Kennicutt, R. 1998, ARA&A, 36, 189 [Google Scholar]
- Kewley, L. J., Heisler, C. A., Dopita, M. A., & Lumsden, S. 2001, ApJS, 132, 37 [NASA ADS] [CrossRef] [Google Scholar]
- Kim, D. C., & Sanders, D. B. 1998, ApJ, 119, 41 [Google Scholar]
- Lauberts, A., Bergvall, N. A. S., Ekman, A. B. G., & Westerlund, B. E. 1979, A&AS, 35, 55 [Google Scholar]
- Le Fèvre, O., Saisse, M., Mancini, D., et al. 2003, in SPIE Conf. Ser. 4841, ed. M. Iye, & A. F. M. Moorwood, 1670 [Google Scholar]
- Leitherer, C., Schaerer, D., Goldader, J., et al. 1999, ApJ, 123, 3 [NASA ADS] [Google Scholar]
- Lípari, S., Díaz, R., Taniguchi, Y., et al. 2000, AJ, 120, 645 [NASA ADS] [CrossRef] [Google Scholar]
- Lípari, S. L., Díaz, R. J., Forte, J. C., et al. 2004, MNRAS, 354, L1 [NASA ADS] [CrossRef] [Google Scholar]
- Lípari, S., Bergmann, M., Sánchez, S. F., et al. 2009a, MNRAS, 398, 658 [NASA ADS] [CrossRef] [Google Scholar]
- Lípari, S., Sánchez, S. F., Bergmann, M., et al. 2009b, MNRAS, 392, 1295 [NASA ADS] [CrossRef] [Google Scholar]
- Lonsdale, C. J., Polletta, M. D. C., Omont, A., et al. 2009, ApJ, 692, 422 [NASA ADS] [CrossRef] [Google Scholar]
- Martin, W. L., Penfold, J. E., & Glass, I. S. 1978, MNRAS, 184, 15P [NASA ADS] [Google Scholar]
- Mathewson, D. S., Ford, V. L., & Buchhorn, M. 1992, ApJS, 81, 413 [NASA ADS] [CrossRef] [Google Scholar]
- Mihos, J., & Hernquist, L. 1996, ApJ, 464, 641 [NASA ADS] [CrossRef] [Google Scholar]
- Monreal-Ibero, A., Arribas, S., & Colina, L. 2006, ApJ, 637, 138 [NASA ADS] [CrossRef] [Google Scholar]
- Monreal-Ibero, A., Colina, L., Arribas, S., & García-Marín, M. 2007, A&A, 472, 421 [NASA ADS] [CrossRef] [EDP Sciences] [Google Scholar]
- Monreal-Ibero, A., Arribas, S., Colina, L., et al. 2010, A&A, 517, A28 [NASA ADS] [CrossRef] [EDP Sciences] [Google Scholar]
- Moshir, M., et al. 1990, in IRAS Faint Source Catalogue, version 2.0 [Google Scholar]
- Naab, T., Jesseit, R., & Burkert, A. 2006, MNRAS, 372, 839 [NASA ADS] [CrossRef] [Google Scholar]
- Nardini, E., Risaliti, G., Salvati, M., et al. 2009, MNRAS, 399, 1373 [NASA ADS] [CrossRef] [Google Scholar]
- Osterbrock, D., Fulbright, J., Keane, M., & Trager, S. 1996, PASP, 108, 277 [NASA ADS] [CrossRef] [Google Scholar]
- Pérez-González, P., Rieke, G., Egami, E., et al. 2005, ApJ, 630, 107 [Google Scholar]
- Pimbblet, K. A., Smail, I., Edge, A. C., et al. 2006, MNRAS, 366, 645 [NASA ADS] [CrossRef] [Google Scholar]
- Rampazzo, R., Plana, H., Amram, P., et al. 2005, MNRAS, 356, 1177 [NASA ADS] [CrossRef] [Google Scholar]
- Rodríguez Zaurín, J., Tadhunter, C. N., & González Delgado, R. M. 2009, MNRAS, 400, 1139 [NASA ADS] [CrossRef] [Google Scholar]
- Rodríguez Zaurín, J., Tadhunter, C. N., & González Delgado, R. M. 2010, MNRAS, 403, 1317 [NASA ADS] [CrossRef] [Google Scholar]
- Roth, M. M., Kelz, A., Fechner, T., et al. 2005, PASP, 117, 620 [NASA ADS] [CrossRef] [Google Scholar]
- Salpeter, E. 1955, ApJ, 121, 161 [Google Scholar]
- Sanders, D. B., & Mirabel, I. F. 1996, ARA&A, 34, 749 [NASA ADS] [CrossRef] [Google Scholar]
- Sanders, D. B., Egami, E., Lípari, S., Mirabel, I. F., & Soifer, B. T. 1995, AJ, 110, 1993 [NASA ADS] [CrossRef] [Google Scholar]
- Sanders, D. B., Mazzarella, J. M., Kim, D.-C., Surace, J. A., & Soifer, B. T. 2003, AJ, 126, 1607 [Google Scholar]
- Savage, B. D., & Mathis, J. S. 1979, ARA&A, 17, 73 [NASA ADS] [CrossRef] [Google Scholar]
- Schlegel, J., Finkbeiner, D., & Davis, M. 1998, ApJ, 500, 525 [NASA ADS] [CrossRef] [Google Scholar]
- Seaton, M. 1979, MNRAS, 187, 73 [Google Scholar]
- Shier, L. M., & Fischer, J. 1998, ApJ, 497, 163 [NASA ADS] [CrossRef] [Google Scholar]
- Soifer, B., Neugebauer, G., Matthews, K., et al. 2000, AJ, 119, 509 [NASA ADS] [CrossRef] [Google Scholar]
- Soifer, B. T., Neugebauer, G., Matthews, K., et al. 2001, AJ, 122, 1213 [NASA ADS] [CrossRef] [Google Scholar]
- Strauss, M. A., Huchra, J. P., Davis, M., et al. 1992, ApJS, 83, 29 [NASA ADS] [CrossRef] [EDP Sciences] [Google Scholar]
- Surace, J., Sanders, D., & Evans, A. 2000, ApJ, 529, 170 [NASA ADS] [CrossRef] [Google Scholar]
- Surace, J. A., Sanders, D. B., & Mazzarella, J. M. 2004, AJ, 127, 3235 [NASA ADS] [CrossRef] [Google Scholar]
- Tacconi, L. J., Genzel, R., Lutz, D., et al. 2002, ApJ, 580, 73 [NASA ADS] [CrossRef] [Google Scholar]
- van den Broek, A. C., van Driel, W., de Jong, T., et al. 1991, A&AS, 91, 61 [Google Scholar]
- Veilleux, S., Kim, D. C., Mazzarella, J. M., & Soifer, B. T. 1995, ApJ, 98, 171 [NASA ADS] [Google Scholar]
- Veilleux, S., Kim, D.-C., & Sanders, D. B. 1999, ApJ, 522, 113 [NASA ADS] [CrossRef] [Google Scholar]
- Veilleux, S., Kim, D. C., & Sanders, D. B. 2002, ApJ, 143, 315 [Google Scholar]
- Visvanathan, N., & Yamada, T. 1996, ApJS, 107, 521 [NASA ADS] [CrossRef] [Google Scholar]
- West, R. M. 1976, A&A, 46, 327 [NASA ADS] [Google Scholar]
- West, R. M., Surdej, J., Schuster, H., et al. 1981, A&AS, 46, 57 [Google Scholar]
- Wright, E. L. 2006, PASP, 118, 1711 [NASA ADS] [CrossRef] [Google Scholar]
- Zhou, S., Wynn-Williams, C. G., & Sanders, D. B. 1993, ApJ, 409, 149 [NASA ADS] [CrossRef] [Google Scholar]
Appendix A: Notes on individual sources
The comments about the morphology of the object refer mainly to Fig. 1 in this paper. All the comments referring to the line ratios in the extended regions of the systems are taken from Paper II. The derived ages for the ionizing stellar populations presented in this section are based on the Leitherer et al. (1999) (hereafter LH99) models, for solar metalicity, instantaneous starburst and Salpeter (1955) IMF. Note that because the spectra were not corrected for stellar continuum emission, these ages represent upper limits.
IRAS F01159-4443 (ESO 244-G012): this is an interacting pair with a nuclear separation (NS) of NS ~ 8.5 kpc. The northern galaxy has an optical spectrum of an HII-galaxy, while the southern source is classified as ambiguous at optical wavelengths (Kewley et al. 2001; Corbett et al. 2003). Owing to limited S/N, none of the extended emission seen in the DSS image is visible in our continuum image, where we only detect the brightest, nuclear emission. On the other hand, the Hα emission line map reveals several knots (probably associated with star formation) in the northern galaxy, while half a ring of a radius of 1.7 − 2.5 kpc is visible in the southern source. This image also reveals a prominent bridge joining the galaxies towards the east of the system. In addition, several local peaks of emission are observed to the west, with the brightest ones approximately 6 and 5 kpc from the northern and southern galaxy, respectively. This is one of the few galaxies in the sample for which a 2D study is already available in the literature (Rampazzo et al. 2005), which makes it a good test-case for the VIMOS data. Generally. our results are consistent with those presented there, although they less deep.
IRAS 01341-3734 (ESO-297-G011/G012): these two galaxies are separated by ~25 kpc, which implies the need of two VIMOS pointings to cover the system. According to the IR luminosity distribution provided in Surace et al. (2004) and re-scaling to our adopted distance, the northern galaxy would be outside the LIRG luminosity range (log (LIR/L⊙) = 10.65) while the southern one would remain as a LIRG (log (LIR/L⊙) = 11.06). The northern galaxy has a substantially extended continuum emission that entirely covers our field of view. The Hα map of the source shows a “tightly wound spiral arm” of condensations and knots that is not visible in the continuum image and extends ~4 kpc from the nuclear region. The line ratios at the locations of the knots are typical of an HII region, which is also the case of the nuclear spectrum (Kewley et al. 2001; Corbett et al. 2003). Using the values of the Hα equivalent widths (60 ≲ Hα − EW ≲ 140 Å) and the LH99 models we derived ages for the stellar populations at these locations in the galaxy of t ≲ 6.5 Myr.
In the southern galaxy, the Hα emission is oriented perpendicular to its major axis forming two plumes. As suggested by Dopita et al. (2002), this can be interpreted as if the gas were being blown out in the polar direction like in M 82. This galaxy is also classified as an HII-galaxy at optical wavelengths. The Hα equivalent width values in the nuclear region, and therefore the derived ages for the stellar populations, are similar ages to those found in the northern source.
IRAS 04315-0840 (NGC 1614): this is a well studied, late merger, with bright, spiral structures at scales of few kpc (1–3 kpc). In addition, the ACS HST image of the galaxy shows relatively faint extended emission, with a loop-like feature to the southeast of the system and a tidal tail that is extended ~1 arcmin (20 kpc) to the southwest of the nuclear region. The Hα image of the source, sampling the central ~9.5 × 9.5 kpc2, shows several knots and condensations extended over the spiral arm to the east of the system, which is the faintest in continuum emission. These knots are clearly visible in the Hα − EW image, where additionally a ring-like structure emerges surrounding the nuclear region (diameter, d ~ 0.7 kpc). The presence of this ring of star formation was already reported by Alonso-Herrero et al. (2001) in their HST NICMOS detailed study of a sample of this LIRG. This galaxy has been classified as an HII-galaxy at all wavelengths studied (Veilleux et al. 1995; Alonso Herrero et al. 2001; Corbet et al. 2003), and the line ratios at the location of the ring are consistent with photoionization by stars. Using the Hα equivalent width values at these locations (100 ≲ Hα − EW ≲ 190 Å) and the LH99 models, we derived ages of t ≲ 6 Myr for the stellar populations at these locations in the galaxy.
IRAS 05189-2524: according to our VIMOS images, this ULIRG is a compact object, especially as seen in the Hα emission line map. Low surface brightness tidal structures extending up to ~12 kpc from the nuclear region, are seen in the HST ACS images of the galaxy. The nuclear optical spectrum of the galaxy is that of a Sy2 galaxy.
IRAS 06035-7102: this is a double system with a nuclear separation of ~9 kpc. The peaks of the continuum and the Hα emission have an offset of 1 and 1.4 kpc for the eastern and the western sources respectively. Both the continuum and the Hα images show a prominent tidal tail to the NE of the system extended ~21 kpc, which coincides with the location of several knots and condensations seen in the HST WFPC2 image. This galaxy is classified as a ULIRG and therefore excluded in the study of the ionization mechanisms in the extended regions of LIRGs presented in Paper II. However, Duc et al. (1997) classified this galaxy as an HII-galaxy in their long-slit spectroscopic study of a large sample of 24 ULIRGs. If we assume that the knots observed along the already mentioned tidal tails are regions of enhanced star formation, which is a reasonable assumption, we can use the Hα equivalent width values at these locations to estimate an age of the stellar populations. We find Hα equivalent width values of 75 < Hα − EW < 120 Å, which corresponds to ages of t ≲ 6.5 Myr.
IRAS 06076-2139: this system consists of two galaxies in interaction with a rather complex morphology. The HST image of the source shows a ring of a diameter of ~8 kpc surrounding the nuclear region of the sourthern galaxy, while relative faint, extended emission is observed on both sides of the northern galaxy. The ring feature is clearly visible in the Hα image. A detailed study of the galaxy using the current VIMOS dataset was already presented in Arribas et al. (2008). The authors found that although thet interact, it is unlikely that these two galaxies finally merge. The southern nucleus, as well as the ring and the external clumps, has HII-like line ratios. The derived ages for the stellar populations at these locations are t ≲ 10 Myr. The two clumps of ionized gas emission observed to the west of the system similar properties to that of TDGs candidates detected in ULIRGs (Monreal-Ibero et al. 2007; Arribas et al. 2008).
IRAS 06206-6315: the HTS WFPC2 image of the system shows a double nuclei structure (NS ~ 4.3 kpc) that is also visible in the VIMOS continuum, and even more clearly in the Hα image. The latter shows a tidal tail starting in the north and bending towards the southeast, which contains a local peak of emission. IRAS 06206-6315 is classified as a ULIRG and has an optical spectrum of a Sy2 galaxy.
IRAS F06259-4708 (ESO 255-IG007): two VIMOS pointing were used during the observation of this triple system. The two brightest galaxies, are separated by a distance of ~11 kpc, while the third one is located at ~15 kpc towards the southeast of the main pair. The central galaxy presents two prominent spiral arms/tidal tails in the HST ACS images, which can be also delineated in both our continuum and Hα VIMOS images, specially the one for the ionized gas. The HST ACS image of the southern galaxy, which is the faintest in both the continuum and the Hα images, shows dust features crossing the galaxy body. Our VIMOS images show an offset between the continuum and the ionized gas emission of ~1.4 kpc. High Hα equivalent width values (100 ≲ Hα − EW ≲ 290 Å) are found in the circumnuclear regions of the northern galaxy, towards the west and the south of of the central galaxy and crossing the body of the southern source from north to south. The line ratios at these locations of the galaxies are consistent with photoionization by stars. We derive ages of t ≲ 6 Myr for the stellar populations located in these regions.
IRAS F06295-1735 (ESO 557-G002): the DSS image of this barred spiral shows a companion galaxy ~42 kpc towards the south. Interestingly, neither the arms nor the bar in the Hα image coincide with those in the continuum image. Corbett et al. (2003) classified this galaxy as an HII-galaxy in their long-slit spectroscopic study of LIRGs. Furthermore the line ratios at almost all locations in the galaxy are consistent with photoionization by stars. However, owing to the poor sensitivity for the continuum image the values of the Hα equivalent width are relatively unconstrained. Therefore, no attempt was made to estimate the ages of the young stellar populations for this galaxy.
IRAS 06592-6313: this spiral galaxy presents a condensation in the Hα image outside its main body at ~3 kpc towards the north, which is not present in the continuum image. The optical, nuclear spectrum of this source is that of an HII-galaxy (Corbett et al. 2003). Moderate Hα equivalent width values (20 < Hα − EW < 50 Å) are found in the nuclear region, in the extreme of the eastern spiral arm and in the condensation to the north of the system. The derived stellar ages are t < 8 Myr.
IRAS F07027-6011 (AM 0702-601): this system consists of two galaxies separated by ~54 kpc. On the basis of its nuclear spectrum, the northern galaxy is classified as a Sy2 at optical wavelengths (Kewley et al. 2001). The Hα image of this galaxy shows two spiral arms towards the north and south, as well as a chain of knots embedded within the main body of the galaxy, which are extended ~3 kpc towards the southwest. This chain structure is even clearer in the corresponding Hα equivalent width image, where it also extends towards the northwest of the galaxy. The location of these knots corresponds to regions of line ratios consistent with photoionization by stars. Using the Hα equivalent width values (100 ≲ Hα − EW ≲ 175 Å) and the LH99 models we derive ages of t ≲ 6 Myr for the stellar populations located in these knots.
The Hα emission from the southern galaxy is more concentrated than that of the continuum, and is associated with several circumnuclear condensations seen in the HST ACS images of the galaxy. There is no nuclear spectroscopic information available in the literature for this galaxy. The line ratios in the circumnuclear region of the galaxy are typical of HII-like regions. The Hα equivalent width values and the stellar ages at this location are similar to those found in the northern galaxy.
IRAS F07160-6215 (NGC 2369): the VIMOS field of view covers the central 7 × 7 kpc2 of this spiral galaxy. Both the continuum and the ionized gas images show irregular structures. Particularly, the Hα image, which is in itself substantially different from the continuum image, is full of knots and condensations. The clumpy structures in the central 5 kpc visible in our Hα image are also observed in the high-resolution HST-NICMOS Paα image of the galaxy (Alonso-Herrero et al. 2006). The regions with relatively high Hα equivalent width values (50 ≲ Hα − EW ≲ 100 Å) observed across the nuclear region and to the west of the system have line ratios consistent with photoionization by stars. The derived stellar ages are t ≲ 6.5 Myr.
IRAS 08355-4944: the DSS and our VIMOS continuum image show a single nucleus galaxy with two tidal tails towards the north and the southwest of the system. However, a double nucleus structure (NS = 0.34 kpc) emerges in the high-resolution HST ACS images of this object. The morphology of the Hα image is very different from that of the continuum. A tidal structure, with a slightly different orientation than the tidal tails observed in the continuum, is visible to the north of the system. The ACS images present two condensations to the west, which are associated with a relatively bright area in the Hα map. Substantially high Hα equivalent width values (140 ≲ Hα − EW ≲ 250 Å) are observed in the circumnuclear region of the galaxy. The line ratios at this location are typical of HII-like regions. Using the LH99 models, we derived stellar ages of t < 6 Myr.
IRAS 08424-3130 (ESO 432-IG006): the Digital Sky Survey (DSS) image of the galaxy shows a pair of spiral galaxies (NS ~ 9 kpc) in interaction, with tidal structures such as a bridge of emission between the two systems and a prominent tidal tail towards the southwest of the southern galaxy. Only part of the nuclear region of both galaxies is covered by our VIMOS field of view. The regions with high Hα equivalent width values (Hα − EW ~ 35 Å) observed in the nucleus and to the east of the nuclear region in the southwestern source have line ratios typical of HII-like regions. The ages derived for the young stellar populations at these locations are t ≲ 7 Myr.
IRAS F08520-6850 (ESO 60-IG016): the HST ACS image of this object shows two disk galaxies in interaction, which is consistent with the morphology observed in both our continuum and the Hα images. Owing to the several dust features crossing the main body of the western source in the ACS image it is hard to decide the location of the nucleus in this galaxy and therefore to estimate a nuclear separation. This dust obscuration would explain the relatively faint continuum and Hα emissions from this galaxy. In the eastern source, there is an offset between the peaks of the continuum and the ionized gas emission of ~1.9 kpc. Note that the Hα image shows a small tidal structure towards the south of the system that is not visible in continuum emission. The higher Hα equivalent width values are concentrated in the nuclear region of the eastern galaxy, where they reach values as high as 410 Å. However, this region is not included in the study presented in Paper II and we did not find spectroscopic information of the source in the literature. Therefore, no attempt to estimate stellar ages was made for IRAS F08520-6850.
IRAS F09022-3615: no tidal features are seen in the VIMOS images of this source, which is classified as a ULIRG. However, both the DSS and the HST ACS images show a prominent tidal tail that emerges from the south and bends towards the east forming a semicircular structure of about ~45 kpc. In addition, the ACS image of the source reveals a complex nuclear structure, with several knots and condensations. Our Hα image shows a rather simple structure, with the bulk of the emission concentrated in the nuclear region. Two regions with high Hα equivalent width values (~170 Å) are observed immediately to the east and west of the nucleus, indicated with a cross in the VIMOS images. Classified as a ULIRG, this source was not included in the work presented in Paper II. In addition, no nuclear spectral classification was found in the literature for this object. Therefore, no attempt to estimate stellar ages was made for IRAS F09022-3615.
IRAS F09437+0317 (IC 563/IC 564): this is a system of two galaxies (north:IC 564/south:IC 563) with a nuclear separation of NS ~39 kpc. Three VIMOS pointings were required to cover most of the emission from the system. IRAS F09437+0317 is a LIRG but each individual galaxy falls outside the LIRG luminosity range. For the adopted distance, the logarithms of the infrared luminosities in solar units are 10.90 and 10.95 for IC 563 and IC 564 respectively (Surace et al. 2004). The continuum and the Hα images show marked differences for both galaxies. For IC 563, a bar is detected in our continuum image at PA ~ 45°, although it is not as well traced in the Hα image. The Hα emission from this galaxy is concentrated in the extremes of the bar, to the northwest and the southeast of the nuclear region. Indeed, the peak of the Hα emission, which is located to the southeast of the system, has an offset of ~4 kpc which respect to the maximum of the continuum emission. High Hα equivalent width values (150 ≲ Hα − EW ≲ 215 Å) are measured in the extremes of the bar, and towards the north of the galaxy. The line ratios at these locations are typical of HII-like regions. Using the LH99 models, we derived stellar ages of t < 6 Myr.
In the northern galaxy (IC 564), two pointings sample the northeast and the southwest of the galaxy, and are referred to as northern pointing 1 and 2 (NP(1) and NP(2)) in Fig. 1. The peak of the Hα emission is located ~6.5 kpc to the east of the nuclear region (both the peak of the continuum and the Hα emission fall in the northeastern pointing). The Hα image shows several concentrations of emission extended throughout the entire body in the galaxy. Equivalent width values in the range 60 ≲ Hα − EW ≲ 140 Å are found towards the east and southwest of the galaxy. The line ratios at these locations in the galaxy are consistent with photoionization by stars. Using the LH99 models, we derived stellar ages of t ≲ 6.5 Myr.
IRAS F10015-0614 (NGC 3110): this galaxy shows two well defined spiral arms in the DSS image. The spiral arm extended from the east to the south of the galaxy falls outside our field of view. The Hα emission from the galaxy shows clumpy structures to the west and the northeast of the nuclear region extended through the spiral arms, which is also visible in Paα emission (Alonso-Herrero et al. 2006). Hα equivalent widths ranging from 100 Å up to values as high as 266 Å are found coinciding with the location of such clumpy structures. The derived ages for the stellar populations in these regions are t ≲ 6 Myr. However, note that because of the low S/N of the continuum image in this particular case the values of the Hα equivalent width are less constrained. Finally, the DSS image shows a companion galaxy observed ~37 kpc towards the southwest, with which it might be interacting.
IRAS F10038-3338 (IC 2545): the ACS image of the galaxy shows two close (NS ~ 0.6 kpc) nuclei as well as two prominent tidal tails bending from the east towards the north and from the west towards the south respectively. This last tail seems to be associated with a relatively bright region in the Hα emission line map. However, because of S/N limitations, these tidal structures are not visible in our continuum map. High Hα equivalent width values (110 ≲ Hα − EW ≲ 140 Å) are found confined to a small region of few spaxels immediately towards the southeast of the nucleus in our VIMOS images (marked with a cross). The line ratios at this location are that of an HII-like region, and the derived ages for the stellar populations are t ≲ 6 Myr.
IRAS F10257-4338 (NGC 3256): the HST ACS image of the galaxy shows extended emission up to ~30 kpc from the nuclear region. In addition, a rather complex structure emerges in the center of the galaxy, with several knots, condensations, and other tidal structures. This complex structure is also clearly visible in our VIMOS images, which samples the central ~6 × 6 kpc2 of the galaxy. Lípari et al. (2004) and Alonso-Herrero et al. (2006) presented ESO-NTT and HST WFPC2-WF2 Hα, and Paα images of the galaxy, which show clumps located to the east and west of the nuclear region. These knots are also visible in our Hα images and moreover, in the corresponding Hα equivalent width image of the galaxy. The line ratios at the location of these knots are consistent with photoionization by stars. Using the Hα equivalent width values, which are indeed remarkably high (200 ≲ Hα − EW ≲ 280 Å) and the LH99 models, we estimate an age of t ≲ 5 Myr for the stellar populations in these knots.
IRAS F10409-4556 (ESO 264-G036): this is an isolated barred spiral galaxy as seen in the DSS image. The bar is visible both in the continuum and Hα images at PA ~ 70°. On the other hand, the spiral arm towards the north of the galaxy is only detected in the ionized gas map. The southern spiral arm falls mostly outside the VIMOS field of view. There are two relatively symmetric regions with enhanced Hα emission associated with the bar structure. In addition, a notable increase of the ionized gas emission is also observed in the extreme of the spiral arm extended to the north of the galaxy. These regions have line ratios consistent with that of HII-like regions, and therefore trace the location of ongoing star-formation activity. The Hα equivalent width values are 30 ≲ Hα − EW ≲ 90 Å and Hα − EW ~ 160 Å for the regions associated to the bar and the spiral arm respectively. Using the LH99 models, we obtain ages of t ≲ 6 and ≲ 5 Myr for the young stars at these locations in the galaxy. Owing to the low signal of the continuum image in the extreme of the northern spiral arm the Hα equivalent width values at that location are less constrained.
IRAS F10567-4310 (ESO 264-G057): the DSS image of the galaxy shows a spiral structure with two spiral arms to the east and west of the nuclear region. The image also shows what might be a bar structure crossing the nuclear region at PA ~ 10o and an additional extended emission to the southeast of the galaxy. Unfortunately, the the data-cube of IRAS F10567-4310 showed vertical patterns over the entire field of view. Possibly due to a non-linear effect, it was not possible to remove these patterns during the reduction process. However, these patterns are only important if the S/N is low, and therefore, although they affect the morphology of the continuum (and the corresponding Hα − EW) image, they have no effect on the Hα emission map. The Hα image shows a rather complex morphology, with an impressive “tightly wound spiral arm” extended over the entire VIMOS field of view (~10 × 10 kpc2).
IRAS F11255-4120 (ESO 319-G022): this is a barred spiral with a ring extended up to ~4 kpc from the nuclear region, clearly detected in our Hα image. Interestingly, the orientation of the bar seen in continuum emission (PA ~ 110o) is different from that of the ionized gas emission (PA ~ 150o). Several knots, along the ring structure, are observed in the Hα and the Hα − EW images. The line ratios measured over the entire ring are consistent with photoionization by stars. The Hα − EW values at the location of the knots are ≳ 100 Å, being as high as 348 Å. Using the LH99 models we obtain ages t ≲ 6 Myr for the stellar population located in this ring of star formation.
IRAS F11506-3851 (ESO 320-G030): the DSS image of the galaxy shows an overall spiral structure with extended emission over ~ 30 kpc. Our VIMOS images covers the central ~6 × 6 kpc2. The Hα image shows four concentration of ionized gas emission towards the north and the northwest of the nuclear region. In addition, a ring structure, not detected in the continuum image, emerges in the Hα, and moreover, the Hα − EW image. The presence of this ring was already reported by Alonso-Herrero et al. (2006) in their study of NICMOS-Paα images of LIRGs. The line ratios over such a ring structure are typical for HII-like regions. High Hα − EW values (100 ≲ Hα − EW ≲ 150 Å) are found for the knots observed within the ring, revealing the location of a stellar population of an age of t ≲ 6 Myr.
IRAS 12043-3140 (ESO 440-IG058): this system consists of two merging galaxies with a separation of ~6 kpc. The northern galaxy is very compact and has an optical spectrum that is a mix between LINER and HII (Corbett et al. 2003). The southern source presents several knots in the continuum and Hα maps as well as two tidal plumes that are visible in the corresponding DSS image. The knots are aligned forming what seems to be a ring-like structure as seen in the Hα − EW image. This galaxy is spectroscopically classified as an HII-galaxy at optical wavelengths, and the radio observations of (Condon et al. 1996) suggest that it dominates the far-IR emission. The line ratios observed throughout the “ring structure” are consistent with photoionizations by stars. Hα − EW values (50 ≲ Hα − EW ≲ 110 Å) are found through the “ring structure” in the southern source. Using the LH99 models, we derive ages for the stellar populations at these locations of t ≲ 6.5 Myr.
IRAS 12115-4656 (ESO 267-G030): This galaxy, which is included in the catalog of interacting galaxies of Arp & Madore (1987), might be interacting with IRAS 12112-4659, located ~260 arcsec (97.5 kpc) to the southwest of the system. A prominent spiral arm/tidal tail is observed to the northwest of the galaxy in the DSS image of the object, but not detected in the VIMOS continuum or Hα images. The Hα image shows a concentration of the emission towards the nuclear region, while a ring structure emerges in the corresponding Hα − EW image. The line ratios over the whole extension of the ring are consistent with those of HII-like regions. Using the values of the Hα − EW, ranging from 30 Å to values as high as 107 Å to the south of the nucleus, we derived ages of t ≲ 6.5 Myr for the stellar populations within this star-forming ring.
IRAS 12116-5615: this is one of the few objects for which the morphological classification is controversial. The overall structure of the galaxy is substantially symmetric, which would be in favor of morphological class 0. However, the HST ACS image of the galaxy reveals a more complex nuclear morphology, with a bright structure emerging from the east of the nuclear region and bending towards the northwest of the system. It is possible that this complex, nuclear structure is related to a past/recent interaction, in which case this galaxy would be classified as type 2, our preferred morphological classification.
The Hα image of the source shows a compact morphology, with most of the emission concentrated in the central 3 × 3 kpc2 region. Since no nuclear optical diagnostic was found for this objects and the nuclear regions of the system were excluded from the work presented in Paper II, no attempt was made to estimate the ages of the young stellar populations for this galaxy.
IRAS 12596-1529 (MGC-02-33-098): the DSS image of this source shows a distorted, elongated morphology along PA ~ 65° with diffuse emission to the northwest of the galaxy, which falls outside our VIMOS field of view. This galaxy is interacting with MCG-02-33-099, ~ 115 arsec (~37 kpc) to the southeast of the system. IRAS 12596-1529 was misclassified as 2 in Paper I. A double nucleus structure is not clearly visible in the DSS image, the presence of two nuclei separated by ~12 arcsec (NS ~ 3.8 kpc) has already been reported in the past by other authors (Veilleux et al. 1995; Kewley et al. 2001; Alonso-Herrero et al. 2006), and therefore, the galaxy is morphologically classified as 1.
Most of the Hα emission from the system is concentrated around the two nuclei, coinciding with the location of high Hα − EW values (100 ≲ Hα − EW ≲ 130 Å). Both nuclei are also spectroscopically classified as HII-like regions at optical wavelengths. (Veilleux et al. 1995; Corbett et al. 2003). Using the LH66 models we derived ages of t ≲ 6 Myr at these location in the system.
Finally, it is important to mention that the data cube of IRAS F12596-1529 showed vertical patterns within a region to the east of our VIMOS FOV. In this case these vertical patterns are due to an incorrect fiber tracing during the reduction and affects both the continuum and the Hα maps. After substantial experimentation, it was not possible to entirely correct for this effect during the reduction process.
IRAS F13001-2339 (ESO 507-G070): the DSS image of the source shows a relatively small (tidal?) structure towards the northeast of the main body of the galaxy, which is in itself rather symmetric. In addition, the high resolution HST ACS image of the galaxy also shows a second high surface brightness region ~4 kpc towards the southwest of the nuclear region. Although this region could be identified as a secondary nucleus, it has no associated extended structure, and it seems more like a massive star-forming region. At this stage, it is straightforward to understand that it is not trivial to classify this object as 0, 1, or 2. Our preferred classification for IRAS F13001-2339 is as type 2.
A hint of this already mentioned secondary bright concentration is visible in our continuum image, but it disappears in the image tracing the ionized gas emission. In addition, the Hα image of the galaxy shows a small structure extending ~4.5 kpc to the northwest of the nuclear region. The optical, nuclear spectrum of the source is that of a LINER (Corbett et al. 2003), which is also consistent with the line ratios found in the extended regions.
IRAS F13229-2934 (NGC 5135): the HST WFPC2 image the galaxy shows a spiral structure, with several clumps in the nuclear region and relatively faint emission extending up to ~40 arcsec (~11 kpc) to the southeast of the galaxy. The spiral structure is still distinguishable in our VIMOS continuum images. The morphology of the ionized gas emission is substantially different than that of the continuum, with some filaments extending towards the west of the galaxy and a region of enhanced emission coinciding with the nuclear clumps observed in the HST WFPC2 and NICMOS-Paα images of the source (Alonso-Herrero et al. 2006). This region is better delineated in the Hα − EW image, where some clumps with high Hα − EW values (90 ≲ Hα − EW ≲ 120 Å) are also visible. Although the nuclear spectrum of the galaxy is that of a Sy2-galaxy, the line ratios found throughout this region are consistent with photoionization by stars. We derived ages of t ≲ 6 Myr for the stellar populations located in the already mentioned clumpy structures.
IRAS F14544-4255 (IC 4518): this system is a merger between two galaxies with a nuclear separation of NS ~12 kpc, which were observed separately using two VIMOS pointings. The eastern source is an elongated galaxy with a faint tail extended towards the northwest of the system, as seen in the DSS image. The western source is more compact, although some extended emission is also observed towards the northwest of the galaxy. In the western source, there is a knot of emission to the south of the nuclear region, also observed in our VIMOS continuum image. This is spectroscopically confirmed as a late type (G) star in our Galaxy. The morphology of the ionized gas emission observed for the western galaxy is consistent with that of the continuum emission. However, this is not the case for the eastern source. For this galaxy the region of the major enhancement of Hα emission to the southeast of the galaxy corresponds to a region with substantially faint continuum emission. Indeed, the peak of the ionized gas is located ~2.5 kpc to the southeast of the peak of the continuum emission.
The optical spectrum of the western source is that of a Sy2. On the other hand, no nuclear spectroscopic classification was found for the eastern galaxy. However, the line ratios found towards the southeast of the galaxy are consistent with photoionization by stars. Using the Hα − EW values (90 ≲ Hα − EW ≲ 140 Å) at this location we estimate stellar ages of t ≲ 6 Myr.
IRAS F17138-1017: the HST ACS image of the source shows an overall symmetric, spiral morphology, based on which the galaxy would be morphologically classified as 0. However, the image also shows a rather complex structure in the central regions, where some condensations and dust lanes are observed. Furtthermore, a double nucleus structure emerges in the 3.4 μm image of Zhou et al. (1993), with a nuclear separation of NS ~ 1 kpc. The adopted morphological class for this galaxy is type 2.
Unfortunately, the data-cube of IRAS F17138-1017, as in the case of IRAS F10567-4310, showed vertical patterns over the entire field of view. As mentioned before, these residuals are only important if the S/N is low, and therefore, although they affect the morphology of the continuum (and the corresponding Hα − EW) image, they have no effect on the Hα emission map. Interestingly, the Hα image of the galaxy shows a very different morphology than the one observed in the HST ACS image. The structure of the ionized gas is substantially compact, with no signs of spiral structure and is concentrated towards the central region. In general, this is consistent with the structure observed in the Paα image of the galaxy (Alonso-Herrero et al. 2006). The latter also reveals the presence of knots and condensations in the nuclear region.
IRAS F18093-5744: this system consists of three galaxies in interaction (West 1976), of which each individual galaxy was observed separately. The nuclear separations between the northern (IC 4687) and the central galaxy (IC 4686) and between the central and the southern galaxy (IC 4689) are NS ~ 10 kpc and ~20 kpc respectively. The IRAS pointing in centered on the northern pair (IC 4687/IC 4686). Using the results of Surace et al. (2004) and re-scaling to our adopted distance we derived an infrared luminosity of log (LIR/L⊙) = 11.49 from these two galaxies. Bearing in mind that the total log (LIR/L⊙) is 11.57, the contribution to this quantity from the southern source is log (LIR/L⊙) = 10.79. The HST ACS image of the system shows a spiral-like morphology for IC 4687, with several knots and concentrations in the nuclear region. On the other hand, IC 4686 appears to be a very compact object, whose continuum emission is contaminated by a late type star (G or K) in our galaxy. In addition, the HST ACS image shows extended emission clearly linking the galaxies IC 4687 and IC 4686. In the case of IC 4689, a spiral morphology is observed in the HST ACS image, without clear evidence of strong interaction.
The Hα map of IC 4687 shows three main regions of enhanced ionized gas emission corresponding to the center of the galaxy and other two regions immediately to the north and south of the nuclear region. The high-resolution HST-NICMOS Paα image of the galaxy reveals that these regions correspond to several knots and condesations (Alonso-Herrero et al. 2006). In addition, a fourth region is observed to the southwest of the nucleus, although with weaker Hα emission. In IC 4686 the Hα emission from the source is highly concentrated in the nuclear region of the galaxy. Ionized gas emission is also observed extending towards the north-west of the nuclear region. This emission seems to delineate the continuum, extended emission seen in the HST image, linking this galaxy with IC 4687. Both IC 4687 and IC 4686 have been classified as HII galaxies on the basis of their nuclear spectra (Kewley et al. 2001; Corbett et al. 2003). Additioanlly all extranuclear regions with enhanced emission have line ratios consistent with an HII-like region. Therefore, using the LH99 models and the extremely high Hα − EW values (200 ≲ Hα − EW ≳ 420 Å) we derive ages of t ≲ 5 Myr for the stellar populations at these locations. Finally, the Hα image of IC 4689 shows a region of enhanced emission crossing the galaxy from the southeast to the northwest of the galaxy, with some clumps in the extremes, and towards the center of this region. Although no nuclear spectral classification is available for this source, the clumps are located in regions with line ratios typical for HII regions. The Hα − EW values found at these location are ~100 Åand the corresponding derived stellar ages are t ≲ 6 Myr.
IRAS F21130-4446: this ULIRG has been already identified in the past as a double nucleus system with a nuclear separation of NS = 5.4 kpc (Dasyra et al. 2006). The HST WFPC2 of this source shows a complex morphology, with several knots and condensations distributed over the entire body of the galaxy. The two brightest condensations seen in the HST image are located in the central and northern regions and are likely associated with the nuclei of the two merging galaxies. However, owing to the peculiar morphology of the galaxy, it is hard to locate the exact position of the two nuclei. The peak of the continuum emission in our VIMOS image coincides with the location of the northern condensation. Interestingly, the most intense Hα emission is observed in the central region of the system, coinciding with the location of the central condensation seen in the HST image. Farrah et al. (2003) found that star-formation activity is responsible for most of the LIR of this source. Using the high Hα − EW values (200 ≳ Hα − EW ≳ 400 Å) found at this location, and the LH99 models we derive ages of t ≲ 5 yr for the stellar populations.
IRAS F21453-3511 (NGC 7130): the DSS image of the galaxy shows a relatively asymmetric morphology with extended emission over ~35 kpc. The central 10 × 10 kpc2 are covered by the VIMOS field of view. The high-resolution HST WFPC2 image reveals a nuclear spiral structure, with two spiral arms to the north and south of the nuclear region. Such a spiral structure is also visible in our continuum, and moreover, our Hα image. However, note that the extreme of the southern spiral arm seen in the HST is not covered by our field of view.
Both our Hα and the Paα image of the galaxy (Alonso-Herrero et al. 2006) show that the ionized gas emission is concentrated in the nuclear region and the northern spiral arm. The nuclear, optical spectrum of the source shows a mix between LINER- and Sy-like features (Veilleux et al. 1995; Corbett et al. 2003). On the other hand, the spiral arms have line ratios typical of HII-like galaxies, and therefore it is possible to use the Hα − EW values to estimate the ages of the stellar populations at these locations. Although values of ~60 Å are found over the entire spiral structure, the higher values are concentrated in the northern spiral arm. The Hα − EW values at that location are 100 ≲ Hα − EW ≲ 270 Å, and the derive ages are t ≲ 6 Myr. Finally, it is worth mentioning that this remarkable concentration of Hα emission in the northern spiral arm is perhaps indicative of a past (minor?) interaction that has enhanced the star-formation activity.
IRAS F22132-3705 (IC 5179): our VIMOS images sample the central ~7 × 7 kpc2 of this very extended (~30 kpc) spiral galaxy. The small concentration of continuum emission observed ~1 kpc to the north of the nucleus is a star in the field (Alonso-Herrero et al. 2006). The morphology of the ionized gas emission is substantially clumpier than that of the continuum, with several knots and concentrations spread over the entire extension of the galaxy covered by the VIMOS field of view. Such knots and condensations also observed in the high-resolution HST-NICMOS Paα image of the galaxy (Alonso-Herrero et al. 2006). The optical, nuclear spectrum of the galaxy is that of an HII-galaxy. In addition, HII-like line ratios are found at almost all locations in the VIMOS Hα image. Using the Hα − EW values (60 ≳ Hα − EW ≳ 140 Å) and the LH99 models we derive ages of t ≲ 6.5 Myr for the stellar populations at these locations.
IRAS F22491-1808: this is a double nucleus system with several knots and condensations located in both the nuclear region and the tidal tails observed to the east and northwest of the system. Although the two nuclei are not clearly distinguishable at optical wavelengths, a double nucleus structure emerges at near-IR wavelengths, with a nuclear separation of NS ~ 3 kpc (Surace et al. 2000; Dasyra et al. 2006). Interestingly, our Hα image of the source shows a more compact morphology than that of the continuum, with no evidence for the already mentioned tidal tails. A small region with high Hα − EW values is observed
immediately to the north-west of the nuclear region. This region coincides with the location of some of the knots observed in the HST ACS image. Bearing in mind that this source is classified as an HII-galaxy at all wavelengths studied (e.g. Genzel et al. 1998; Veilleux et al. 1999; Farrah et al. 2003; Imanishi et al. 2007), we use the Hα − EW values (Hα − EW ~ 150 Å) and the LH99 models to determine the age of the stellar populations found at this location. We obtain ages t < 6 Myr, which are consistent with the estimated ages obtained in the imaging study of Surace et al. (2000) for the knots at this location in the galaxy.
IRAS F23128-5919 (AM 2312-591): this is a double nucleus system (NS ~ 4 kpc) with two prominent tidal tails to the north and southeast of the nuclear region that extends over ~45 kpc. Our VIMOS image covers the central ~25 kpc of the galaxy. The double nucleus structure is clearly visible in both the continuum and the Hα image, although the tidal tails are not observed in ionized gas emission. In addition there is a third concentration of Hα emission to the east of the double nucleus structure. The optical spectrum of this galaxy shows a mix between LINER, Sy2 and HII-like features (Duc et al. 1997; Kewley et al. 2001). This galaxy is classified as a ULIRG and therefore, was not included in the study presented in Paper II. Hence, no attempt was made to estimate the ages of the young stellar populations in IRAS F23128-5919. However, note that the concentration of Hα emission seen to the east of the system coincides with the location of the highest Hα − EW values obtained for all the galaxies in our sample, with values as high as 850 Å.
All Tables
Typical flux-percentage error, offset
and C2 kpc values for the (U)LIRGs in the VIMOS
sample.
All Figures
|
Fig. 2 Example of the test performed to estimate the error percentage associated to the relative flux for the particular case of IRAS 13229-2934. Left: standard error of the mean (SE) plotted against the mean value of the flux per spaxel. Right: percentage error distribution. We find that the typical error associated to the flux in this case is 9.8%. |
| In the text | |
|
Fig. 3 Histograms showing the distribution of the offsets, in kpc, between the high surface brightness peak of continuum and the Hα emission for the objects shown in Fig. 1. |
| In the text | |
|
Fig. 4 Ratio between the concentration C2 kpc for the Hα and the continuum emission plotted against the log of the infrared luminosity LIR. Note that there are three points with LIR < 1011 L⊙. These are IRAS F01341-3735N (ESO-297-G011), IRAS F09437-0317S (IC 563) and IRAS F18093-5744S (IC 4689). For these multiple systems at least one of the individual galaxies falls outside the LIRG luminosity range. The points are labeled on the basis of our morphological classification. Type 0: blue squares. Type 1: black stars. Type 2: red circles. |
| In the text | |
|
Fig. 5 Concentration
|
| In the text | |
|
Fig. 6 Reddening coefficient E(B − V) for those objects with nuclear spectroscopic data available in the literature, plotted against the IR luminosities of the sources. See Sect. 5 for details on how the E(B − V) were calculated. The bar in the bottom-right of the plot represents the error associated with the E(B − V) values. |
| In the text | |
|
Fig. 7 Log of the star-formation rates (SFR) in M⊙ yr-1 derived using the the Hα luminosity (SFRHα), without reddening correction, plotted against the log of the SFR obtained using the IR luminosities. We used the results of García-Marín et al. (2009a) for the figure from their sample of ULIRGs. The circles correspond to the objects in our sample, while stars correspond to objects in García-Marín et al. (2009a) sample. Those objects classified as Sy galaxies are indicated in the figure with open symbols. |
| In the text | |
|
Fig. 8 Same as Fig. 7, but the Hα luminosity has been corrected from reddening effects. The nuclear E(B − V) values shown in Table 3 have been used for the objects in our sample (see text for details). On the other hand, a 2D reddening correction was applied for the ULIRGS in the García-Marín et al. (2009a) sample. The AGN dominated source IRAS F05189-2524 and all the objects in our sample with unavailable Hα/Hβ values are not used for the plot. |
| In the text | |
|
Fig. 1 Top panel: DSS image of the galaxy. For those objects for which HST images are available in the literature these are used for the figure. The exceptions are IRAS F13229-2934 and IRAS F21453-3511. For these galaxies the HST image does not cover the entire emission from the galaxies and we prefered to use the DSS images. The box on the DSS or HST images indicates the VIMOS field of view, while the horizontal line in the bottom left of the same images corresponds to a scale of 10 kpc. Second panel: the continuum within the wavelength range 6390–6490 Å (rest frame). Third panel: the Hα emission from the galaxy. Both the continuum and the Hα maps are represented in logarithmic scale, and in arbitrary flux units. Fourth panel: Hα equivalent width (Hα − EW) in Å. With the exception of IRAS F10567-4310 and IRAS F17138-1017, the peak of the continuum emission, identified as the nucleus of the galaxy, is indicated in all the maps with a “plus” sign. For these two galaxies the morphology of the continuum is less constrained because of the presence of vertical patterns (see text for details). In these cases the “plus” sign corresponds to the location of the peak of the Hα emission. Note that two pointings were used to cover the full emission from the galaxy IRAS F09437+0317N (IC 564), which are referred to in the figure as N(P1) and N(P2). |
| In the text | |
|
Fig. 1 continued. |
| In the text | |
|
Fig. 1 continued. |
| In the text | |
|
Fig. 1 continued. |
| In the text | |
|
Fig. 1 continued. |
| In the text | |
|
Fig. 1 continued. |
| In the text | |
|
Fig. 1 continued. |
| In the text | |
|
Fig. 1 continued. |
| In the text | |
|
Fig. 1 continued. |
| In the text | |
|
Fig. 1 continued. |
| In the text | |
|
Fig. 1 continued. |
| In the text | |
|
Fig. 1 continued. |
| In the text | |
|
Fig. 1 continued. |
| In the text | |
|
Fig. 1 continued. |
| In the text | |
|
Fig. 1 continued. |
| In the text | |
|
Fig. 1 continued. |
| In the text | |
|
Fig. 1 continued. |
| In the text | |
|
Fig. 1 continued. |
| In the text | |
|
Fig. 1 continued. |
| In the text | |
|
Fig. 1 continued. |
| In the text | |
|
Fig. 1 continued. |
| In the text | |
|
Fig. 1 continued. |
| In the text | |
|
Fig. 1 continued. |
| In the text | |
Current usage metrics show cumulative count of Article Views (full-text article views including HTML views, PDF and ePub downloads, according to the available data) and Abstracts Views on Vision4Press platform.
Data correspond to usage on the plateform after 2015. The current usage metrics is available 48-96 hours after online publication and is updated daily on week days.
Initial download of the metrics may take a while.