Fig. 2
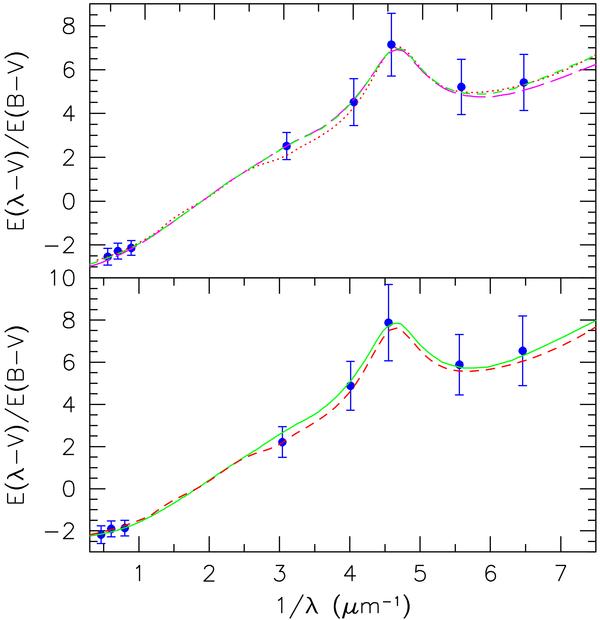
Top panel: HD 39136, a normal curve of our sample (blue filled squares) whose best-fit standard CCM curve corresponds to RV = 2.85 ± 0.47 (red dotted line). The (magenta) long-dashed line is computed as the seventh model in Table 1 of Weingartner & Draine (2001), RV = 3.1, including latest updating (Draine & Li 2007); the (green) short-dashed line is our best-fit dust model: the fifth model in Table 3. Bottom panel: HD 12323, a normal curve of our sample (blue filled squares) whose best-fit standard CCM curve corresponds to RV = 2.30 ± 0.51 (red dashed line); the (green) continuous line is the best-fit dust model: the thirteenth model in Table 3.
Current usage metrics show cumulative count of Article Views (full-text article views including HTML views, PDF and ePub downloads, according to the available data) and Abstracts Views on Vision4Press platform.
Data correspond to usage on the plateform after 2015. The current usage metrics is available 48-96 hours after online publication and is updated daily on week days.
Initial download of the metrics may take a while.