Fig. 10
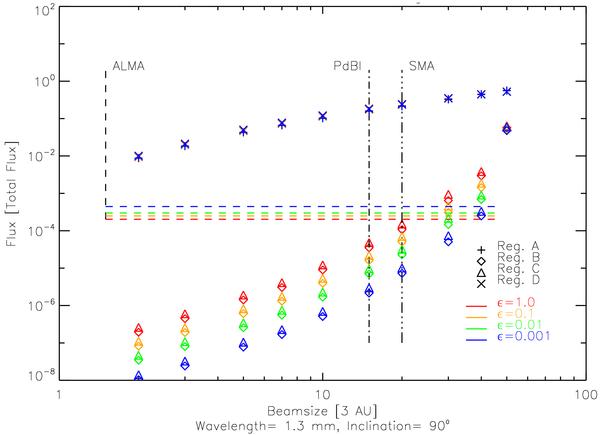
Analysis of image brightness distribution of a circumstellar disk at different evolutionary stages. The results for different evolutionary states are coded in colour. The shape of any mark denotes the region from whence it is taken. Vertical lines indicate resolution limits of selected interferometers. Horizontal lines give the ALMA sensitivity limit, the other two instruments do not have the required sensitivity. The flux is given in units of the total flux. Since this flux depends as well on ϵ, the sensitivity limit is affected. The dependence of the flux in regions B and C on ϵ is shown.
Current usage metrics show cumulative count of Article Views (full-text article views including HTML views, PDF and ePub downloads, according to the available data) and Abstracts Views on Vision4Press platform.
Data correspond to usage on the plateform after 2015. The current usage metrics is available 48-96 hours after online publication and is updated daily on week days.
Initial download of the metrics may take a while.