


Fig. 1
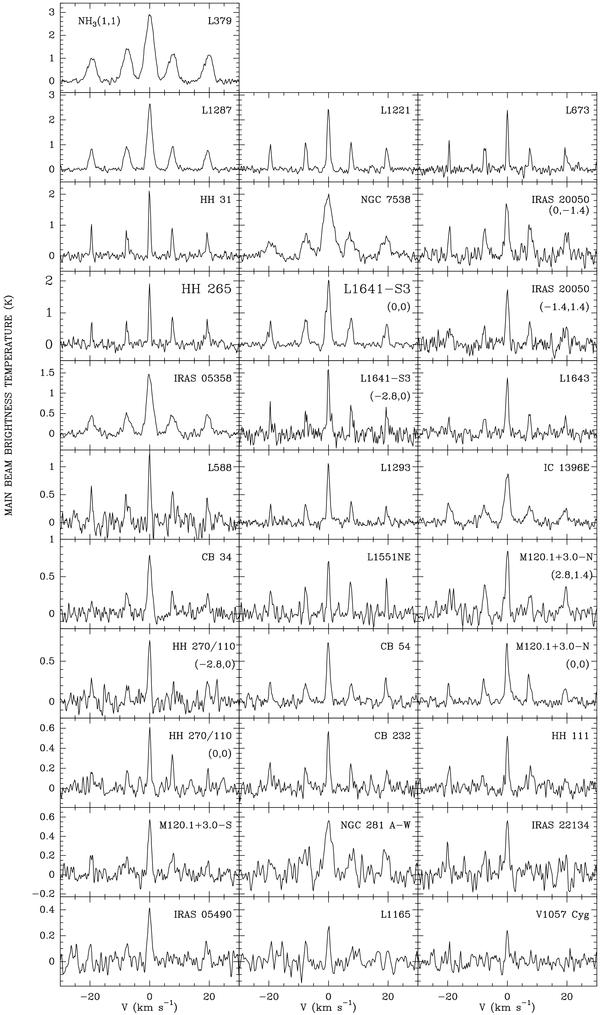
Spectra of the (J,K) = (1,1) inversion transition of the NH3 molecule toward the positions given in Table 2 for the detected sources. The vertical axis is the main beam brightness temperature and the horizontal axis is the velocity relative to the center of the main line (as given in Table 2). For M120.1+3.0-N, L1641-S3, HH270/110 and IRAS 20050, spectra at two different positions are shown. The spectrum of V1057 Cyg corresponds to the average of positions with detected emission in a five-point grid.
Current usage metrics show cumulative count of Article Views (full-text article views including HTML views, PDF and ePub downloads, according to the available data) and Abstracts Views on Vision4Press platform.
Data correspond to usage on the plateform after 2015. The current usage metrics is available 48-96 hours after online publication and is updated daily on week days.
Initial download of the metrics may take a while.