| Issue |
A&A
Volume 527, March 2011
|
|
|---|---|---|
| Article Number | A41 | |
| Number of page(s) | 27 | |
| Section | Interstellar and circumstellar matter | |
| DOI | https://doi.org/10.1051/0004-6361/200912916 | |
| Published online | 24 January 2011 | |
Online material
Appendix A: Results for individual sources
A.1. M120.1+3.0-North
This region is associated with a bipolar molecular outflow (Yang et al. 1990) and contains several low-luminosity objects. Two of these objects, IRAS 00213+6530 and IRAS 00217+6533, fall inside the outflow lobes. On the basis of the geometrical position of IRAS 00213+6530, close to the emission peak of the blue-shifted gas, and its cold IR colors, Yang et al. (1990) favor this source as the driving source of the outflow. We observed the region around both IRAS sources in ammonia.
The NH3 structure (Fig. A.1) consists of two sub-condensations, each one peaking very close to the position of an IRAS source. This suggests that both IRAS sources are embedded in the high density gas. Our results show that the velocity is different for each clump (see Table 2 and Fig. A.2). The observed difference in velocity is consistent with a gravitationally bound rotational motion of the two clumps.
The association of IRAS 00213+6530 with an ammonia emission maximum supports its identification as the outflow exciting source. However, we note that IRAS 00217+6530 falls very close to the position of an ammonia emission peak, it lies close to the emission peak of the outflow redshifted gas and its IRAS colors are characteristic of an embedded source (although the source appears confused in the 60 and 100 μm IRAS bands). Therefore, based on these results, both IRAS sources are valid candidates for the outflow excitation.
The radio continuum sources detected in the region (Anglada, G., private communication) fall outside the ammonia condensation (see Fig. A.1), therefore they appear to be unrelated to the star-forming region.
A.2. M120.1+3.0-South
This region is associated with several IRAS sources and with a CO bipolar outflow (Yang et al. 1990). The outflow is asymmetric, with the red lobe more intense than the blue one. Two sources, IRAS 00259+6510 and IRAS 00256+6511, lie inside the outflow lobes. Yang et al. proposed IRAS 00259+6510 as the driving source of the outflow. We observed the region around both sources in ammonia.
The NH3 condensation (Fig. A.3) shows an elongated structure in the NW-SE direction. Both IRAS 00259+6510 and IRAS 00256+6511 are located close to the ammonia emission maximum, suggesting that they are embedded sources. Both sources have similar IRAS colors, but appear confused at 60 and 100 μm. Therefore, we cannot favor one of them as the driving source of the outflow.
A cm radio continuum source is detected at the edge of the ammonia condensation (Anglada, private communication). Unfortunately, the information available for this source is not enough to infer the nature of the emission.
A.3. L1287
The dark cloud L1287 is associated with an energetic bipolar molecular outflow (Snell et al. 1990; Yang et al. 1991). At the center of the outflow lies the source IRAS 00338+6312, that has been proposed as the outflow exciting source (Yang et al. 1990). The brightest visible object in the region, RNO 1 (Cohen 1980), lies ~40″ NE of the nominal IRAS position. However, because of the low angular resolution of the IRAS data, several young stellar objects (a FUOri binary system RNO 1B/1C and several radio continuum sources) fall inside the IRAS error ellipsoid. Kenyon et al. (1993) proposed the FU Ori star RNO 1C as the outflow exciting source. However, additional studies by Anglada et al. (1994) favored a jet-like radio continuum source, VLA 3, located very close to the IRAS nominal position and to the symmetry center of the polarization pattern (Weintraub & Kastner 1993), as the most likely candidate to be the exciting source. The detection of H2O maser emission associated with VLA 3 (Fiebig 1995), and the interpretation of the H2O velocity pattern as a infalling disk (Fiebig 1997) further supports VLA 3 as the outflow exciting source.
The region was observed in HCN, HCO+ (Yang et al. 1991), CS (Yang et al. 1995; McMuldroch et al. 1995), and in NH3 (Estalella et al. 1993). Estalella et al. (1993) found a gradient in the NW-SE direction, which was interpreted as caused by the rotation of the core.
 |
Fig. A.1
Contour map of the main beam brightness temperature of the main line of the ammonia (J,K) = (1,1) inversion transition (thick line) in the M120.1+3.0-North region. The lowest contour level is 0.3 K, and the increment is 0.1 K. The observed positions are indicated with small crosses. The half-power beam width of the telescope is shown as a circle. The positions of several relevant objects in the region are indicated. The CO bipolar outflow (thin line) is from Yang et al. (1990) (solid contours indicate blueshifted gas, and dashed contours indicate redshifted gas). Dashed straight line is the axis of the pos-vel diagram of Fig. A.2. |
| Open with DEXTER | |
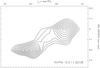 |
Fig. A.2
Position-velocity diagram of the NH3(1, 1) main line along an axis passing toward the two maxima (PA ~ 45°) of the M120.1+3.0-North condensation. The lowest contour level is 0.3 K and the increment is 0.05 K. |
| Open with DEXTER | |
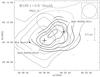 |
Fig. A.3
Same as Fig. A.1, for the M120.1+3.0-South region. The NH3 lowest contour is 0.2 K and the increment is 0.1 K. CO bipolar outflow map is also shown (Yang et al. 1990)(solid contours indicate redshifted gas, and dashed contours indicate blueshifted gas). |
| Open with DEXTER | |
 |
Fig. A.4
Same as Fig. A.1, for the L1287 region. The NH3 lowest contour is 0.3 K and the increment is 0.2 K. The map of the CO bipolar outflow is from Snell et al. (1990). |
| Open with DEXTER | |
The condensation we mapped (Fig. A.4) is clearly elongated in the northwest-southeast direction, perpendicular to the CO outflow axis. We have found a velocity gradient of ~1.23 km s-1 pc-1 in the NW-SE direction. Both results agree well with the results of Estalella et al. (1993). The ammonia emission peaks near the position of IRAS 00338+6312, RNO 1B/1C and VLA 3. However, because of the small projected angular separation between all these objects (~5″ − 10″), we cannot distinguish from our data which of these sources is the best candidate for exciting the outflow in terms of its proximity to the ammonia emission peak. This region was studied in NH3 with high angular VLA resolution (Sepúlveda 2001; Sepúlveda et al. in preparation). These observations revealed that the central region toward the sources has a complex structure and exhibits a complex kinematics.
A.4. L1293
Yang (1990) discovered a bipolar molecular outflow in this region and proposed IRAS 00379+6248 as its driving source.
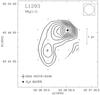 |
Fig. A.5
Same as Fig. A.1, for the L1293 region. The NH3 lowest contour level is 0.2 K, and the increment is 0.1 K. |
| Open with DEXTER | |
The NH3 structure presents two emission maxima separated by ~4′ (Fig. A.5). The strongest ammonia peak coincides with the position of IRAS 00379+6248. The HCN, HCO+ and 13CO emission also peak toward the IRAS position (Yang 1990). This IRAS source is not detected at 12 μm and its infrared flux increases steeply toward longer wavelengths. These IR results, along with its association with strong NH3 emission and with an H2O maser (Wouterloot et al. 1993), suggest that IRAS 00379+6248 is a young stellar object, deeply embedded in the high density gas, and the most plausible exciting source of the outflow. The weaker emission peak is not associated with any known object.
A.5. NGC 281 A-West
This region is associated with a bipolar molecular outflow proposed to be driven by the luminous source IRAS 00494+5617 (Snell et al. 1990; Henning et al. 1994). A near-IR cluster (Carpenter et al. 1993) and several H2O maser spots are found in association with the IRAS source (Henning et al. 1992). Henning et al. (1994) modeled the observed spectral energy distribution of the source from 1 μm to 1 mm, concluding that it is a very good candidate for a deeply embedded and very young protostellar object.
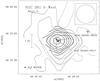 |
Fig. A.6
Same as Fig. A.1, for the NGC 281 A–West region. The NH3 lowest contour level is 0.15 K, and the increment is 0.075 K. The CO bipolar outflow is from Snell et al. (1990) (solid contours indicate redshifted gas, and dashed contours indicate blueshifted gas). |
| Open with DEXTER | |
We detected an ammonia clump (Fig. A.6), which appears unresolved with our beam. The NH3 emission peaks at the position of IRAS 00494+5617 . Our results agree with the 40′′ angular resolution NH3 map of Henning et al. (1994), which reveals that the ammonia clump is elongated along the east-west direction with the emission peaking toward the position of the IRAS source. CS emission mapped by Carpenter et al. (1993) with an angular resolution of ~50″, also peaks toward the position of the IRAS source. These results, along with the spectral energy distribution of the source, suggest that IRAS 00494+5617 is a very young object deeply embedded in the high density gas and that it is the most likely candidate to excite the outflow.
Our ammonia results suggest that there is no significant amount of dense gas in association with the source IRAS 00492+5618, located ~2′ to the west of IRAS 00494+5617.
A.6. HH 31
The HH 31 jet is a sinusoidal chain of knots having a linear extent of ~0.2 pc (Herbig 1974; Gómez et al. 1997). Cohen & Schwartz (1983) found four near-IR sources (IRS1, IRS2, IRS3 and IRS4) in the vicinity of the jet, being IRS 2, that coincides with IRAS 04248+2612, the proposed exciting source of the jet. This source has been detected at millimeter and sub-millimeter wavelengths (Moriarty-Schieven et al. 1994) and apparently drives a small molecular outflow (Moriarty-Schieven et al. 1992), although no map has been published. In near-IR images, IRAS 04248+2612 (IRS 2) appears as a bipolar reflection nebula (Padgett et al. 1999). We searched for ammonia emission toward the four near-IR sources.
The ammonia condensation (Fig. A.7) is elongated in the NE-SW direction, and it agrees with the NH3 map shown by Benson & Myers (1989). The NH3 emission peak is displaced ~3′ (~0.14 pc) to the SW of the HH 31 IRS2 position. To our knowledge, no source has been reported toward the position of the NH3 emission peak. We suggest that high sensitivity observations could reveal a deeply embedded object at this position. The sources HH 31 IRS2 and IRS1 lie at the edge of the condensation. We have not detected significant emission toward IRS3 and IRS4, which lie far away (more than 8′) from the condensation.
 |
Fig. A.7
Same as Fig. A.1, for the HH 31 region. The NH3 lowest contour is 0.3 K and the increment is 0.2 K. The position of the HH 31 knots is from Gómez et al. (1997). |
| Open with DEXTER | |
A.7. HH 265
HH 265, located in the L1551 cloud, is an isolated Herbig-Haro object whose exciting source still remains unknown. Swift et al. (2005, 2006) mapped the region in NH3 and CS. From their results, these authors suggest that the cloud is likely a prestellar core showing signs of undergoing the first phases of gravitational collapse.
We discovered an H2O maser (see Fig. 3) toward the position of the HH object. The maser shows two velocity components, whose line parameters are given in Table 4. The H2O maser emission suggests the presence of a nearby exciting source, which could be also responsible for the excitation of HH 265. However, it is also suggested that HH265 could be the end of a jet emanating from the source LkHα 358 (Moriarty-Schieven et al. 2006; Movsessian et al. 2007).
Our ammonia map (see Fig. A.8) shows that both
the H2O maser and the HH object fall inside the ammonia condensation, but
they are displaced by ~ (~0.08 pc) to the SE of the position of the ammonia maximum. We suggest that a
sensitive search in the submm, mm, or cm range in the vicinity of the NH3
emission peak could reveal an embedded object, responsible for the excitation of HH
265. The mass derived for this region (see Table 5) exceeds the virial mass by a factor of five, a result that may indicate
that a significant fraction of the cloud is still undergoing the process of
gravitational collapse toward a central, embedded protostar, in good agreement with
the results obtained by Swift et al. (2005, 2006).
(~0.08 pc) to the SE of the position of the ammonia maximum. We suggest that a
sensitive search in the submm, mm, or cm range in the vicinity of the NH3
emission peak could reveal an embedded object, responsible for the excitation of HH
265. The mass derived for this region (see Table 5) exceeds the virial mass by a factor of five, a result that may indicate
that a significant fraction of the cloud is still undergoing the process of
gravitational collapse toward a central, embedded protostar, in good agreement with
the results obtained by Swift et al. (2005, 2006).
A 20 cm source, located ~2′ to the NE of HH 265, was detected by Snell & Bally (1986). However, this source lies outside the ammonia condensation and was not detected at shorter wavelengths (6 cm and 2 mm; Snell & Bally 1986), suggestive of a negative spectral index, characteristic of background extragalactic sources. Unfortunately, sensitive observations reaching the position of the ammonia maximum are not available.
 |
Fig. A.8
Same as Fig. A.1, for the HH 265 region. The NH3 lowest contour is 0.3 K and the increment is 0.2 K. |
| Open with DEXTER | |
A.8. L1551 NE
L1551 NE is a young stellar object in the L1551 molecular cloud. It is located very
close (~ )
to the well-studied embedded source L1551 IRS 5. The proximity to the red lobe of the
large IRS 5 outflow has made difficult the study of the L1551 NE outflow itself.
Moriarty-Schieven et al. (1995) suggest the
presence of a weak molecular outflow from this source and Devine et al. (1999) concluded that L1551 NE drives an HH flow
(HH 454) and that probably drives the objects HH 28 and 29, that were previously
attributed to IRS 5.
)
to the well-studied embedded source L1551 IRS 5. The proximity to the red lobe of the
large IRS 5 outflow has made difficult the study of the L1551 NE outflow itself.
Moriarty-Schieven et al. (1995) suggest the
presence of a weak molecular outflow from this source and Devine et al. (1999) concluded that L1551 NE drives an HH flow
(HH 454) and that probably drives the objects HH 28 and 29, that were previously
attributed to IRS 5.
We detected intense ammonia emission toward the position of L1551 NE (see spectrum in Fig. 1), but the proximity to IRS 5, which is associated with a strong NH3 condensation (Torrelles et al. 1983) makes it difficult to separate both components. Higher angular resolution observations of high density tracers are needed to detect the structure of dense gas around L1551 NE.
A.9. L1634
L1634 contains two H2 bipolar jets (Hoddap & Ladd 1995). One of them, HH 240-241, is constituted by several H2 knots symmetrically located from the source IRAS 05173 − 0555, which has been proposed as the driving source (Hoddap & Ladd 1995; Davis et al. 1997). The jet extends from east (knots HH 241A-D) to west (knots HH 240A-D). Knots HH 240A and HH 241A were previously known as RNO 40 and RNO 40E (Jones et al. 1984). CO(J = 3 → 2) observations (Davis et al. 1997) reveal the presence of a molecular outflow associated with IRAS 05173 − 0555, a cm and a submm source, proposed as a Class 0 (Beltrán et al. 2002). The second bipolar jet only has two knotty bow shocks (knots 9 and 4; Hoddap & Ladd 1995; see Fig. A.9). The near-IR source IRS 7 located near the center of the jet, has been proposed as the powering source of this outflow (Hoddap & Ladd 1995; Davis et al. 1997). The CO outflow (Lee et al. 2000) shows a distribution similar to that of the H2 jets.
 |
Fig. A.9
Same as Fig. A.1, for the L1634 region. The NH3 lowest contour is 0.3 K and the increment is 0.15 K. Dashed lines indicate outflow axes discussed in text. IRAS 05173–0555 is the proposed exciting source for the HH240-241 outflow and the source IRS 7 is the proposed exciting source for the second outflow (knots 4 and 9). |
| Open with DEXTER | |
Our map (Fig. A.9) shows that both, IRAS
05173-0555 and IRS 7 are associated with dense gas. The NH3 emission peak
is located close (~ pc)
to the position of the IRAS source. This source has a steeply rising spectral energy
distribution through the IRAS bands and it is detected at cm, mm, and submm
wavelengths (see references in Table 6). These
results together with its association with the ammonia core suggest that IRAS
05173 − 0555 is a very young object deeply embedded in the high density gas and that
it is a very good candidate for exciting the optical jet HH240-241 and the molecular
outflow. The near-IR source IRS 7 is displaced by
~
pc)
to the position of the IRAS source. This source has a steeply rising spectral energy
distribution through the IRAS bands and it is detected at cm, mm, and submm
wavelengths (see references in Table 6). These
results together with its association with the ammonia core suggest that IRAS
05173 − 0555 is a very young object deeply embedded in the high density gas and that
it is a very good candidate for exciting the optical jet HH240-241 and the molecular
outflow. The near-IR source IRS 7 is displaced by
~ (~0.19 pc) to the SE of the position of the emission maximum. The association of
IRS 7 with high density gas suggests that it is a very young stellar object as
suggested by Beltrán et al. (2002).
(~0.19 pc) to the SE of the position of the emission maximum. The association of
IRS 7 with high density gas suggests that it is a very young stellar object as
suggested by Beltrán et al. (2002).
We noted that the central velocity of the ammonia lines increases to the west of the peak position. We found a velocity shift of ~0.31 km s-1 between the ammonia peak position and the position of knot HH 240 A. This knot has a large proper motion away from the IRAS source (Jones et al. 1984). The velocity shift detected could results from the interaction between the jet and the dense gas. Indeed, Whyatt et al. (2009) find that the HH objects are illuminating the molecular gas, enhancing the emission of the HCO+ associated with a dense molecular condensation within the ammonia core.
A.10. IRAS 05358+3543
IRAS 05358+3543 was proposed as the exciting source of a bipolar molecular outflow (Snell et al. 1990). Observations at higher angular resolution resolved the outflow into at least three different outflows, two of them forming a quadrupolar system (Beuther et al. 2002a). Tofani et al. (1995) detected four H2O maser spots close to the IRAS position. Millimeter and submillimeter emission around the IRAS source resolved at least four cores in the region within separations between 4″–6″. At least two of these mm cores will be likely the exciting source of the molecular outflows (Beuther et al. 2007; Leurini et al. 2007).
We found an NH3 condensation elongated in the north-south direction (Fig. A.10). The NH3 emission peaks at the position of the IRAS source. This positional coincidence, as well as its proximity to H2O maser emission, along with the fact that its infrared emission increases steeply toward longer wavelengths, suggest that IRAS 05358+3543 is a very young stellar object, deeply embedded in the high density gas, favoring this object as the driving source of the molecular outflow. Our angular resolution doesn’t allow us to infer about the subcores into the region.
 |
Fig. A.10
Same as Fig. A.1, for the region around IRAS 05358+3543. The NH3 lowest contour is 0.3 K and the increment is 0.2 K. The CO bipolar outflow is from Snell et al. (1990). |
| Open with DEXTER | |
A.11. L1641-S3
L1641-S3 is a bipolar CO outflow located in the southern part of the L1641 cloud (Fukui et al. 1989; Wilking et al. 1990; Morgan et al. 1991). The outflow is centered on the source IRAS 05375 − 0731 (= FIRSSE-101), which has been proposed as its exciting source. The source has been detected in the near-IR, centimeter, millimeter and submillimeter wavelengths ranges with an spectral energy distribution of a Class I source (see references in Table 6). H2O maser emission (Wouterloot & Walmsley 1986) has been detected toward the IRAS source. An H2 giant flow is found probably associated with the IRAS source (Stanke et al. 2000)
In all the positions where emission is detected, the NH3 spectra show two velocity components at 3.8 and 4.9 km s-1, in all the hyperfine lines. Each velocity component peaks at a different position. In Fig. A.11 we show the observed spectra at the position of the emission peak for each velocity component.
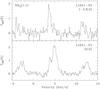 |
Fig. A.11
Spectra of the NH3(1, 1) emission at (0,0) and (–2.8, 0), the positions of the emission maximum for each velocity component of L1641-S3. Offsets are with respect to the position given in Table 1. |
| Open with DEXTER | |
 |
Fig. A.12
Same as Fig. A.1, but for the emission associated with the component at ~4.9 km s-1 for the L1641-S3 region. The NH3 lowest contour is 0.3 K and the increment is 0.2 K. The map of the CO bipolar outflow is from Morgan et al. (1991). |
| Open with DEXTER | |
The region has also been mapped in NH3 with an angular resolution of 40″ by Harju et al. (1993). These authors present a map of the overall emission, which is consistent with our results, taken into account the difference in the beam sizes and the slight difference in the region covered by the maps. However these authors do not discuss the presence of two velocity components. Since the two velocity components are clearly defined in our spectra, in Figs. A.12 and A.13 we present separate maps of the two velocity components, and in our analysis we will discuss separately each velocity component.
The map of the component at 4.9 km s-1 (Fig. A.12) reveals a well defined NH3 condensation with the position of source IRAS 05375-0731 well centered in the structure and coinciding with the maximum of emission. The main axis of this condensation is elongated roughly in the NW-SE direction, perpendicular to the outflow axis. We also detected NH3 emission toward the NE of the region mapped, near the positions of IRAS 05377-0729 and IRAS 05375-0727, suggesting that these sources may be also associated with high density gas. However, none of the two sources is detected at submillimeter wavelengths (Dent et al. 1998) and only IRAS 05375-0727 has a near-IR counterpart (Strom et al. 1989). Unfortunately, our map is not completed around the positions of these sources, so that we cannot establish their association with high density gas.
 |
Fig. A.13
Same as Fig.A.1, but for the emission associated with component at ~3.8 km s-1 for the L1641-S3 region. The NH3 lowest contour is 0.4 K and the increment is 0.2 K. The map of the CO bipolar outflow is from Morgan et al. (1991). |
| Open with DEXTER | |
The map of the component at 3.8 km s-1 is shown in Fig. A.13. The spatial distribution presents an irregular morphology, with several local maxima. The source IRAS 05375-0731 appears projected toward this structure, but it is not as clearly associated with any particular feature.
In summary, we observe that for the 4.9 km s-1 component, the position of the source IRAS 05375-0731 is better centered on the NH3 structure and closer to the emission maximum than for the 3.8 km s-1 component. In addition, the main axis of the 4.9 km s-1 structure is aligned roughly perpendicular to the outflow axis. Finally, the line widths of the 4.9 km s-1 component are broad (see Table 2), suggesting that the dense gas is suffering a perturbation by an embedded object, while the line widths of the 3.8 km s-1 component are narrow, suggestive of a starless core. From these results, we conclude that the source IRAS 05375-0731 is likely associated with the dense gas component at 4.9 km s-1. A study of the local heating through a high angular resolution mapping of the NH3(1, 1) and NH3(2, 2) could confirm this association.
A.12. CB 34
The small Bok globule CB 34 (Clemens & Barvainis 1988) is associated with the source IRAS 05440+2059, which is the proposed driving source of a bipolar molecular outflow (Yun & Clemens 1994a). IRAS 05440+2059 has near-IR, submillimeter, millimeter and centimeter counterparts (see references in Table 6). Near-IR images revealed a small aggregate of YSOs embedded in the cloud (Alves & Yun 1995). Alves (1995) discovered, from optical and near-IR images, a variable object CB34V, which is identified as an embedded PMS object (Alves et al. 1997).
Moreira & Yun (1995) discovered in this region four Herbig-Haro objects (HH 290S, HH 290 N1, HH 290 N2 and HH 291) and several H2 structures (labeled Q1, Q2, Q3, Q4, hh291X and hh291Y) . These authors suggested that the objects HH 290S/N1/N2 constitute an optical jet driven by an embedded near-IR source HH 290 IRS, that the structure Q1-Q4 is a well collimated H2 jet driven by an embedded object (labeled Q), and that hh291X, hh291Y and HH 291 could be bright knots of an embedded jet, whose driving source remains undetected.
 |
Fig. A.14
Same as Fig. A.1, but for the CB 34 region. The NH3 lowest contour is 0.15 K and the increment is 0.1 K. The three jets discussed in text are indicated by dotted lines. The map of the CO bipolar outflow is from Yun & Clemens (1994a). |
| Open with DEXTER | |
The ammonia structure, unresolved with our beam, peaks close to the position of IRAS 05440+2059 (see Fig. A.14), in good agreement with the results obtained from other high-density tracers (CS, Launhardt et al. 1998; HCN, Afonso et al. 1998; NH3, Codella & Scappini 1998). The sources HH 290 IRS and CB34V appear in projection toward the ammonia core, suggesting that they are young stellar objects embedded in the dense molecular gas. These results support the identification of IRAS 05440+2059 as the exciting source of the molecular outflow, and HH290 IRS as the exciting source of an optical jet. The source Q lies at the edge of the condensation. The HH 291 jet, two of whose knots are only detected in the near-IR, also appears projected toward the high density gas, so it can be tracing an embedded jet as proposed by Moreira & Yun (1995). We suggest that the exciting source of this jet could be located in the line connecting the knots and close to the position of the NH3 emission maximum. High-resolution observations could reveal the position of this embedded object.
A.13. L1617
A map of the overall L1617 region where NH3 emission is detected is shown in Fig. A.15. The map encloses the ammonia condensations associated with HH 270/110 and with HH 111, as well as their molecular outflows.
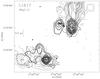 |
Fig. A.15
Ammonia cores in L1617 (thick contours) overlapped on the CO outflow maps of Reipurth & Olberg (1991) (thin contours). Symbols used in this map are same as Fig. A.1. Close-ups of the clumps of the NW region (associated with HH 270/110) and SE region (associated with HH 111) are shown in Fig. A.16 and Fig. A.17 respectively. Ammonia contour levels are the same as in these figures. Additional positions were observed near HH 113 (~12′ east from HH111). |
| Open with DEXTER | |
A.13.1. HH 270/110
HH 110 is a well collimated jet located in the L1617 molecular cloud (Reipurth & Olberg 1991). Reipurth et al. (1996) discovered a second jet, HH 270, ~3′ to the NE of HH 110 and proposed the near-IR source HH 270 IRS as its exciting source. The position of HH 270 IRS lies very close to the error ellipsoid of IRAS 05489+0256 and both sources could be associated. VLA observations of HH 270 IRS at cm wavelengths (Rodríguez et al. 1998) revealed that this source (named VLA1) is elongated along the axis of the HH 270 jet, suggesting that it traces the base of the flow. Reipurth et al. (1996) suggest that the HH 270 jet suffers a grazing collision with a nearby molecular cloud core, thus producing a deflected flow, which is manifested as the HH 110 jet. The kinematical studies (Riera et al. 2003; López et al. 2005) provide some additional evidence of the interaction between the outflow and the surrounding material.
About 3′ to the SW of HH 270 IRS, lies IRAS 05487+0255, a source with a spectral energy distribution steeply rising toward longer wavelengths. IRAS 05487+0255 is associated with a near-IR and a VLA source (Davis et al. 1994; Garnavich et al. 1997; Rodríguez et al. 1998), driving a bipolar molecular outflow (Reipurth & Olberg 1991; see Fig. A.15) and a H2 jet (Davis et al. 1994; Garnavich et al. 1997) running almost north-south. A second near-IR source, powering another H2 jet extending in the north-south direction, is found a few arcseconds to the south (Davis et al. 1994; Garnavich et al. 1997).
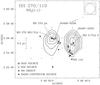 |
Fig. A.16
Same as Fig. A.1, for the HH 270/110 region. The NH3 lowest contour level is 0.2 K and the increment is 0.15 K. The sources discussed in text are indicated. |
| Open with DEXTER | |
Our ammonia map (Fig. A.16) shows two high density clumps, separated by ~0.4 pc, apparently corresponding with two local maxima observed in the 13CO extended structure mapped by Reipurth et al. (1996). The emission of the eastern NH3 clump peaks at the position of HH 270 IRS/VLA 1, suggesting that this object is embedded in the high density gas, and giving support to its identification as the powering source of the HH 270 jet.
The HH 110 flow is observed toward the SE edge of the western ammonia clump (see Fig. A.16). The coincidence of the NH3 clump at the point where the HH 270/110 flow changes abruptly its direction, gives strong support to the scenario proposed by Reipurth et al. (1996), where the HH 110 jet arises as a result of the deflection of the HH 270 jet after a collision with a high-density clump. Our NH3 observations provide evidence for the presence of such a high-density clump.
The western NH3 clump peaks near the positions the proposed exciting sources of the molecular outflow and the H2 jets (see Fig. A.16). This result suggest that these sources are embedded objects, giving support to their identification as the driving sources of the molecular outflow and the H2 jets.
The remaining five centimeter continuum sources detected in the region by Rodríguez et al. (1998, see Fig. A.16) have negative spectral index, characteristic of non-thermal emission. One of them (VLA 4) could be associated with the knot HH 110 H and the others are probably background objects unrelated with the star-forming region.
A.13.2. HH 111
 |
Fig. A.17
Same as Fig. A.1, for the HH 111 region. The NH3 lowest contour level is 0.15 K and the increment is 0.07 K. |
| Open with DEXTER | |
HH 111, in the L1617 cloud, is a well collimated jet associated with a highly collimated molecular outflow apparently driven by IRAS 05491+0247 (Reipurth & Oldberg 1991; see Fig. A.15), which also has a centimeter counterpart, VLA 1 (Rodríguez & Reipurth 1994, Anglada et al. 1998b). Reipurth et al. (1997b) proposed that the HH 111 jet (together with HH 113 and HH 311) constitutes a giant flow with a total extent of 7.7 pc. Gredel & Reipurth (1993) detected an H2 bipolar jet, HH 121, which is almost perpendicular to HH 111 and appears to emanate from the IRAS/VLA 1 source. Cernicharo & Reipurth (1996) resolved the CO outflow into a quadrupolar structure along the axes of the HH111 and HH 121 jets. At smaller scales, the source VLA 1 also shows evidence of a similar quadrupolar structure (Reipurth et al. 1999). These authors detected an additional centimeter source, VLA 2 (~3″ NW of VLA 1), which exhibits some evidence of driving its own outflow.
The NH3 map (Fig. A.17) shows a condensation with the emission peaking near the positions of the proposed triple system. The spectral energy distribution of the IRAS source is steeply rising toward longer wavelengths. Altogether this suggests that the sources are deeply embedded in the high density gas.
The remaining radio continuum sources detected in the region (Anglada et al. 1998b) are not associated with dense gas and have negative spectral index, indicating that probably almost all are non-thermal background sources unrelated to the star-forming region.
A.13.3. HH 113
We observed a five-point grid around HH 113 (not shown in Fig. A.15), which is located ~12′ to the east of the HH 111 complex. We did not detect significant emission in any of these positions. Reipurth et al. (1997a) suggest that HH 113 is the eastern boundary of the HH 111 complex. The lack of dense gas around this object, and that there are no sources in its vicinity suggests a non local origin for this object, giving support to its identification as part of the HH 111 complex.
A.14. IRAS 05490+2658
 |
Fig. A.18
Same as Fig. A.1, for the region around IRAS 05490+2658. The NH3 lowest contour is 0.2 K and the increment is 0.1 K. The center of the near-IR cluster (Carpenter et al. 1993), which extends over a region of 1 pc in size, is indicated. The CO bipolar outflow is from Snell et al. (1990). |
| Open with DEXTER | |
IRAS 05490+2658 lies ~5′ east of the H II region S242. This IRAS source has been proposed as the exciting source of a poorly collimated molecular outflow (Snell et al. 1990), although it is displaced ~1′ to the SE of the geometrical center of the outflow. A 6 cm radio continuum source has been detected close to the position of the IRAS source (Carpenter et al. 1990). A near-IR cluster, extending over a region of ~1 pc in size, has been detected in the region by Carpenter et al. (1993).
The condensation we mapped in NH3 (Fig. A.18) has the emission peak displaced ~1′ (~0.7 pc) to the north of the IRAS source position, but it is very close to the center of the outflow and to the center of the near-IR cluster. This result suggests that some cluster members could be embedded stellar objects, in agreement with the Carpenter et al. (1993) suggestion, and that the outflow exciting source could be located close to the NH3 maximum and to the north of the IRAS position. Sensitive cm continuum observations toward this position could reveal this object.
A.15. CB 54
CB 54 is a Bok globule associated with the source IRAS 07020-1618, which has been proposed as the exciting source of a highly collimated bipolar molecular outflow (Yun & Clemens 1994a). The IRAS source is double in the near-IR (two components CB54YC1-I and CB54YC1-II separated by 12″: Yun & Clemens 1994b) and it is detected also at cm (Yun et al. 1996; Moreira et al. 1997) and mm wavelengths (Launhardt & Henning 1997). Only CB54YC1-II is detected in the mid-infrared images, but three new mid-infrared sources with no near-infrared counterpart were detected spatially coincident with both the IRAS source and the center of the dense core (Ciardi & Gómez Martín 2007).
We found a compact NH3 condensation (Fig. A.19) with the emission peaking at the position of the IRAS source, which has a cm radio continuum counterpart. The spectral energy distribution of the IRAS souce is steadily rising at longer wavelengths. Altogether this suggests that the IRAS source is a very young object deeply embedded in the high density gas and favors it as the exciting source.
 |
Fig. A.19
Same as Fig. A.1, for the CB 54 region. The NH3 lowest contour is 0.25 K and the increment is 0.1 K. The CO bipolar outflow is from Yun & Clemens (1994a). |
| Open with DEXTER | |
A.16. L379
The dark cloud L379 contains the bright source IRAS 18265-1517, which was proposed as the exciting source of a bipolar molecular outflow (Hilton et al. 1986; Wilking et al. 1990). The red- and blue-wing emission overlap for most of the outflow extension, but the emission maxima are not coincident. This structure has been interpreted as two outflows centered north and south of the IRAS source (Kelly & McDonald 1996). Observations at mm and submm wavelengths have revealed two distinct clumps of dust continuum emission located several arcsecs northwest and southwest, respectively from the IRAS nominal position. This interpretation is supported by the two velocity components found in C18O spectra (McCutcheon et al. 1995; Kelly & Mcdonald 1996). Kelly & McDonald (1996) suggest that the dust clumps probably contain the driving sources of the molecular outflows.
We found an NH3 condensation (Fig. A.20) with the emission peaking at the position of IRAS 18265-1517. The spectral energy distribution of this IRAS source rises steeply at longer wavelengths. Altogether this suggests that the IRAS source is a deeply embedded object. Although our ammonia lines are broad, a hint of two velocity components can be appreciated in the satellite lines (see Fig. 1), in agreement with the C18O results (Kelly & McDonald 1996). Both submm sources appear to be associated with NH3 emission, but our angular resolution does not allow us to favor one of them in terms of the proximity to the NH3 maximum.
 |
Fig. A.20
Same as Fig. A.1, for the L379 region. The NH3 lowest contour level is 0.3 K and the increment is 0.2 K. The position of the two dust clumps is indicated by an asterisk. The map of the CO bipolar outflow is from Kelly & Macdonald (1996). |
| Open with DEXTER | |
The physical parameters we obtained for this region (Table 5) indicate that L379 is a massive region (M ~2000−3700 M⊙). The estimated luminosity of the IRAS source is Lbol ~ 1.6 × 10⁴L⊙ (Kelly & McDonald 1996). The high mass obtained from NH3, together with the high luminosity of the source could indicate that this source is a massive protostellar object, and thus that L379 is a high-mass star-forming region.
A.17. L588
Reipurth & Eiroa (1992) discovered two isolated Herbig-Haro objects, HH 108 and HH 109, in this region and proposed IRAS 18331-0035 as their driving source. Ziener & Eislöffel (1999) found that both HH objects consist of several bright knots, some of them with H2 counterpart. Chini et al. (1997) found two 1.3 mm sources, the stronger is coincident with the IRAS source and the fainter, HH 108 MMS, has no counterpart. At present it is unclear which one of these two sources is the driving source of the HH objects. Parker et al. (1991) detected broad line wings in CO spectra taken toward the IRAS position.
 |
Fig. A.21
Same as Fig. A.1, for the L588 region. The NH3 lowest contour is 0.3 K and the increment is 0.15 K. The position of the HH 108 and HH 109 knots are from Ziener & Eislöffel (1999). |
| Open with DEXTER | |
The NH3 map (Fig. A.21) shows a
condensation elongated in the NE-SW direction, similarly to the molecular cloud mapped
in CO by Parker et al. (1991). The ammonia
emission maximum is located at the position of IRAS 18331-0035. This result, along
with the spectral energy distribution, suggests that the IRAS source is a very young
object deeply embedded in the high-density gas. Although the source HH 108 MMS is
located inside the NH3 condensation, it is displaced
~ (~0.1 pc) to the NE of the emission peak. Owing to its association with the
NH3 emission peak, it appears that the source IRAS 18331-0035 is the
deepest embedded object and constitutes a very good candidate for the energy source of
the HH complex.
(~0.1 pc) to the NE of the emission peak. Owing to its association with the
NH3 emission peak, it appears that the source IRAS 18331-0035 is the
deepest embedded object and constitutes a very good candidate for the energy source of
the HH complex.
From our data we found that the mass of this region exceeds the virial mass by more than a factor of five (see Table 5). This result could indicate that the cloud is in process of gravitational collapse.
A.18. L673
Armstrong & Winnewisser (1989) detected an extended bipolar molecular outflow in this region and proposed the source IRAS 19180+1116, which coincides with the object RNO 109 (Cohen 1980), as its driving source. In a previous work (see Paper I) we have observed in NH3 a region of ~10′ × 7′ around the object RNO 109. Those observations revealed an ammonia structure of ~5′ × 2′ elongated from northwest to southeast. It consists of three subcondensations peaking at the positions of sources IRAS 19180+1116 (RNO 109), IRAS 19180+1114 and IRAS 19181+1114. The source IRAS 19180+1114 is located close to the strongest emission maximum.
The region was mapped in CS by Morata et al. (1997). The CS emitting region is elongated in the NW-SE direction and is
more extended ( )
than the region mapped in ammonia in Paper I. This extended CS emission encompasses
the NH3 condensation, and has the emission peak displaced ~8′ to the
south-east of IRAS 19180+1114.
)
than the region mapped in ammonia in Paper I. This extended CS emission encompasses
the NH3 condensation, and has the emission peak displaced ~8′ to the
south-east of IRAS 19180+1114.
 |
Fig. A.22
Same as Fig. A.1, but for the L673 region. The NH3 lowest contour level is 0.45 K and the increment is 0.3 K. The NH3 map obtained in previous observations is also included. The IRAS sources associated with the ammonia structure are (from north to south) IRAS 19180+1116(=RNO 109), IRAS 19180+1114 and IRAS 19184+1118. The map of the CO molecular outflow is from Armstrong & Winnewisser (1989). |
| Open with DEXTER | |
To complete the study in NH3 of this region, we carried out new observations, covering the region around the CS emission maximum. In Fig. A.22 we show the complete NH3 map of the region (including the data from Paper I). The new observations reveal that the NH3 emission further extends to the SE, where we found the strongest NH3 maximum of the whole region. Up to now, no source has been found toward this position. Morata, Girart & Estalella (2003, 2005) have found that this core splits in multiple condensations, with no signs of star formation. Most of the condensations are transient, in the sense that they are not gravitationally bound.
A.19. IRAS 20050+2720
Bachiller et al. (1995) mapped a molecular outflow consisting of three pairs of lobes emanating from the vicinity of IRAS 20050+2720, suggesting that two or three independent outflows are driven by young sources embedded in the core. Chen et al. (1997) found a cluster of near-IR sources with three subclusters, two of them are associated with IRAS 20050+2720 and IRAS 20049+2721, respectively. IRAS 20050+2720 was resolved at centimeter wavelengths in two components at subarsec scale (Anglada et al. 1998a) and in four sources at millimeter wavelengths. Two of them, which are separated ~20″, are suggested to be protostellar collapse candidates (Choi et al. 1999; Beltrán et al. 2008). An analysis of the velocity fields of H2O masers (Furuya et al. 2005) indicates that one of these millimeter sources (MM1) is driving a powerful jet. IRAS 20049+2721 was barely detected in the IRAS 12 and 25 μm bands (2.3 Jy in both bands), but is very bright at longer wavelengths (flux densities are 171.2 and 397.7 Jy in the 60 and 100 μm IRAS bands, respectively). A cm continuum source (Anglada et al. 1998a) is detected in association with this source. CS observations show the emission maximum at the position of IRAS 20050+2720, while only weak CS emission was detected toward IRAS 20049+2721 (Bachiller et al. 1995)
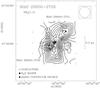 |
Fig. A.23
Same as Fig. A.1, but for the region around IRAS 20050+2720. The NH3 lowest contour level is 0.4 K and the increment is 0.15 K. The centers of the three near-IR subclusters found by Chen et al. (1997) are indicated. The map of the CO multipolar outflow is from Bachiller et al. (1995). |
| Open with DEXTER | |
The NH3 condensation (Fig. A.23) shows two strong emission peaks, very close to the positions of the IRAS sources of the region, suggesting that both sources are associated with high density gas. The velocities of the two NH3 maxima differ by ~2 km s-1 (see Table 2). In Fig. A.24 we show a position-velocity diagram along the northwest-southeast direction. The structure of the NH3 emission is consistent with gravitationally bound rotational motion of two clumps.
 |
Fig. A.24
Position-velocity diagram of the NH3 main line along the NW-SE
direction (P.A. = − 45°) centered on IRAS 20050+2720. The
|
| Open with DEXTER | |

A.20. V1057 Cyg
V1057 Cyg belongs to the small group of the FU Orionis type stars. Before its flare-up in 1970, it was a T Tauri star. A marginally resolved outflow was reported by Levreault (1989) and Evans et al. (1994). They detected only a blue wing extending to the north, but no contour map is shown.
We detected very weak ammonia emission toward this source (see Fig. 1 and Table 2) and the line analysis was carried out by averaging several positions, so no contour map could be made. This weak emission indicates either a low column density gas or that the NH3 emission is very compact. The lack of a large amount of high-density gas agrees with the fact that the source is optically visible.
A.21. CB 232
This Bok globule is associated with IRAS 21352+4307, which is proposed to be the exciting source of a poorly collimated bipolar molecular outflow (Yun & Clemens 1994a). The IRAS source has near-IR (Yun & Clemens 1995) and millimeter counterparts (Launhardt & Henning 1997), and is associated with two compact submillimeter sources. One of them, SMM1, is proposed as a Class 0 candidate (Huard et al. 1999).
We have detected an ammonia condensation (see Fig. A.25) unresolved by our beam, whose emission peak coincides with the position of the IRAS source. Given that the spectral energy distribution of the IRAS source is rising toward longer wavelengths, our results suggest that the IRAS source traces the location of one or several YSOs, deeply embedded in the high density gas, and that the globule is a site of very recent star formation.
 |
Fig. A.25
Same as Fig. A.1, for the CB 232 region. The NH3 lowest contour is 0.2 K and the increment is 0.1 K. The CO bipolar outflow is from Yun & Clemens (1994a). |
| Open with DEXTER | |
A.22. IC 1396E
IC 1396E is a bright-rimmed cometary globule located in the northern periphery of the H II region IC 1396. Wilking et al. (1990) mapped a bipolar molecular outflow and proposed IRAS 21391+5802, an intermediate-mass YSO which is found roughly at the center of the globule, as the exciting source. This IRAS source is detected at near-IR, submm, mm, and cm wavelengths (Wilking et al. 1993; Beltrán et al. 2002). The molecular outflow axis is oriented at a position angle of 75°, which is similar to the position angle of the H2O maser bipolar outflow observed at scales from 1 to 500 AU (Patel et al. 2000).
The region was mapped in NH3(1, 1) and NH3(2, 2) (with an angular resolution of 40″), and several other molecular lines by Serabyn et al. (1993). The NH3 clump mapped by these authors is elongated in the north-south direction and shows a temperature gradient increasing outward from the center and reaching a maximum on the surface most directly facing the stars ionizing IC1396.
Our NH3 map of the condensation (Fig. A.26), obtained with a poorer angular resolution, is elongated in the north-south direction, in good agreement with the one obtained by Serabyn et al. (1993). We found for this source a kinetic temperature of ~19 K, which is above the average for the sources studied in this paper. Although since we only have observed a single position in the NH3(2, 2) line we cannot establish the presence of the temperature gradient reported by Serabyn et al. (1993). The position of the source IRAS 21391+5802 falls very close to the NH3 emission peak. This positional coincidence, as well as the spectral energy distribution of the source, suggest that it is a very young object, deeply embedded in the high density gas and the best candidate to drive the molecular outflow. There are two other IRAS sources in the region, but they lie outside, near the edge of the NH3 condensation (see Fig. A.26). At present, little is known about these sources and further studies are required to investigate their nature and relationship with the molecular condensation.
 |
Fig. A.26
Same as Fig. A.1, but for the IC 1396E region. The NH3 lowest contour level is 0.2 K and the increment is 0.15 K. The map of the CO bipolar outflow is from Wilking et al. (1990). |
| Open with DEXTER | |
A.23. L1165
L1165 is a small cloud whose distance is not well established. Estimates by different
authors range from 200 pc to 750 pc. We will adopt a distance of 750 pc, based on the
assumption that the cloud is part of the IC 1396 region (Schwartz et al. 1991). Parker et al. (1991) discovered a bipolar molecular outflow centered on
IRAS 22051+5848, which was proposed as the exciting source. This IRAS source, that has
a near-IR counterpart (Tapia et al. 1997), is
located ~15″ to the NE of the reflection nebulosity GY 22 (Gyulbudaghian 1982; Reipurth et al. 1997a). Reipurth et al. (1997a) reported a HH object, HH 354, located 11′ NE of the IRAS position and
at the end of a cavity in the molecular cloud, possibly excavated by the molecular
outflow. These authors proposed that HH 354, the cavity, the molecular outflow and the
GY 22 nebulosity are all parts of a single giant outflow excited by the IRAS source.
From near-IR spectroscopy, Reipurth & Aspin (1997) concluded that IRAS 22051+5848 (=HH 354 IRS) is a FUor candidate. The
source IRAS 22051+5849, which has also a near-IR counterpart (Tapia et al. 1997), lies
~
north of IRAS 22051+5848, well off the axis of the proposed giant outflow.
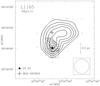 |
Fig. A.27
Same as Fig. A.1, for the L1165 region. The NH3 lowest contour is 0.15 K and the increment is 0.05 K. The IRAS sources are, from north to south, IRAS 22051+5849 and IRAS 22051+4858 (=HH 354 IRS). The CO bipolar outflow is from Parker et al. (1991). |
| Open with DEXTER | |
The NH3 map (Fig. A.27) shows a condensation with the emission peaking very close to the position of IRAS 22051+5848. The IRAS colors of this source are typical of embedded sources (Parker 1991) and it is surrounded by the reflection nebulosity GY 22. Altogether suggest that IRAS 22051+5848 is a young object embedded in the high density gas. IRAS 22051+5849 is located close to the emission maximum and also appears associated with the dense gas, but its IRAS colors corresponding to a blackbody at T > 1000 K are suggestive of a background source (Tapia et al. 1997). This source needs more accurate observations in order to establish its relationship with the core and the outflow.
A.24. IRAS 22134+5834
The distance of this source is established to be 2.6 kpc (Sridharan et al. 2002), although previously a distance of 900 pc was assumed. Dobashi et al. (1994) discovered a molecular outflow associated with the source IRAS 22134+5834, one of the most luminous sources in the Cepheus region. H2 images (Kumar et al. 2002) revealed a dense stellar cluster around the IRAS source, that was interpreted as ring-shaped cluster (Kumar et al. 2003).
The NH3 distribution (Fig. A.28) shows a compact condensation with the emission maximum located at the IRAS position, in agreement with the 12CO and 13CO maps obtained by Dobashi et al. (1994). The IRAS source is bright at FIR wavelengths and not at NIR wavelengths. This and its association with high-density gas, suggest that IRAS 22134+5834 is a very young stellar object, a possible massive protostar as suggested by Dobashi et al. (1994) and Kumar et al. (2003).
 |
Fig. A.28
Same as Fig. A.1, for the region around IRAS 22134+5834. The NH3 lowest contour is 0.2 K and the increment is 0.1 K. The CO bipolar outflow is from Dobashi et al. (1994). |
| Open with DEXTER | |
A.25. L1221
L1221 is a small isolated dark cloud associated with IRAS 22266+6845, which has an energy distribution rising to longer wavelengths. Umemoto et al. (1991) discovered a bipolar molecular outflow centered near the position of the IRAS source. The outflow shows a U-shaped structure open to the northwest. However, CO observations with higher angular resolution showed that the outflow may consist of two bipolar outflows, an east-west outflow associated with the IRAS source and a north-south outflow originating about 25″ to the east of the IRAS source (Lee et al. 2002).
The region was mapped with different high-density tracer molecules (CS, HCO+, HCN, C18O; Umemoto et al. 1991, Lee & Ho 2005). Alten et al. (1997) discovered an HH object, HH 363, in the vicinity of the IRAS source. Anglada et al. (2005) detected three cm continuum sources in this region, but none seems to be associated with the IRAS source. Two mm continuum sources are detected, one of them (MM1) peaks around the IRAS source and toward one of the three infrared sources detected by the Spitzer Space Telescope (Lee & Ho 2005)
The NH3 emission (Fig. A.29) is distributed in a compact condensation centered on the IRAS source, with weak emission extending to the NE. The size of the NH3 condensation (see Table 5) is similar to that obtained in the CS and HCO+ maps (Umemoto et al. 1991), but the emission peaks of the CS, HCO+, and HCN cores are located ~54″ (~0.06 pc) to the south of the NH3 emission peak. A displacement between CS and NH3 emission peaks has been found in several other regions, and has been interpreted by Morata et al. (1997) in terms of chemical evolution.
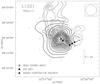 |
Fig. A.29
Same as Fig. A.1, for the L1221 region. The NH3 lowest contour level is 0.25 K and the increment is 0.2 K. The map of the CO bipolar outflow is from Umemoto et al. (1991). |
| Open with DEXTER | |
The presence of the IRAS source toward the ammonia peak, which is located at the center of symmetry of the outflow, favors IRAS 22266+6845 as its exciting source. This contrast with the proposal of Umemoto et al. (1991), who postulate the existence of an object located to the south of the position of the CS emission peak as the outflow driving source.
A.26. NGC 7538
The NGC 7538 molecular cloud is an active site of high-mass star formation containing
five infrared sources (IRS 1, 2, 3, 9 and 11) within an area of
 (Werner et al. 1979). Estimates of the
distance range from 2.2 to 4.7 kpc. We adopt a distance of 2.7 kpc (Kameya et al.
1986). Campbell & Thompson (1984) found a high-velocity outflow near IRS 1.
Kameya et al. (1989) discovered three
additional outflows in the region. Two of them are associated with sources IRS 9 and
IRS 11, but the third one was not associated with any known source. Davis et al.
(1998) detected a collimated H2
jet associated with the IRS 9 outflow, two possible bow shocks related with the IRS 1
and IRS 9 outflows, and a number of H2 compact knots which coincide with
the IRS 11 outflow, and that could be related with it. Davis et al. (1989) also
detected a cavity to the northwest of IRS 1.
(Werner et al. 1979). Estimates of the
distance range from 2.2 to 4.7 kpc. We adopt a distance of 2.7 kpc (Kameya et al.
1986). Campbell & Thompson (1984) found a high-velocity outflow near IRS 1.
Kameya et al. (1989) discovered three
additional outflows in the region. Two of them are associated with sources IRS 9 and
IRS 11, but the third one was not associated with any known source. Davis et al.
(1998) detected a collimated H2
jet associated with the IRS 9 outflow, two possible bow shocks related with the IRS 1
and IRS 9 outflows, and a number of H2 compact knots which coincide with
the IRS 11 outflow, and that could be related with it. Davis et al. (1989) also
detected a cavity to the northwest of IRS 1.
 |
Fig. A.30
Same as Fig. A.1, for the NGC 7538 region. The NH3 lowest contour level is 0.25 K and the increment is 0.2 K. The map of the CO bipolar outflows are from Kameya et al. (1989). |
| Open with DEXTER | |
The NH3 map (Fig. A.30) shows a condensation elongated in the east-west direction. The ammonia emission peak is located toward the position of IRS 11. A secondary emission peak is located near IRS 9. IRS 1-3 also appear projected toward the ammonia condensation. The association of IRS 11 with the ammonia emission peak suggests that this source is the most embedded object, in agreement with the CS observations (Kameya et al. 1986).
The NH3 line profiles show broad intrinsic line widths, with values ranging from ΔV = 1.68 km s-1 to 3.41 km s-1. The broadest intrinsic line width is found very close to the IRS 11 position. Figure A.31 shows a contour map of the NH3 intrinsic line width. The broadening due to the NH3 hyperfine structure is about 0.5 km s-1 and the thermal broadening for the derived kinetic temperature (~28.3 K, see Table 5) is ~0.27 km s-1. Both values are significantly lower than the observed line width, which could indicate turbulent motions of the gas, or that the dense gas is suffering an interaction with the outflows.
 |
Fig. A.31
A contour map of the NH3 intrinsic line width for the NGC 7538 region. The lowest contour level is 1.6 km s-1 and the increment is 0.3 km s-1. |
| Open with DEXTER | |
© ESO, 2011
Current usage metrics show cumulative count of Article Views (full-text article views including HTML views, PDF and ePub downloads, according to the available data) and Abstracts Views on Vision4Press platform.
Data correspond to usage on the plateform after 2015. The current usage metrics is available 48-96 hours after online publication and is updated daily on week days.
Initial download of the metrics may take a while.