Fig. 13
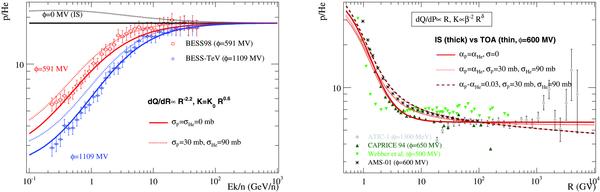
Left panel: p/He ratio as a function of Ek/n, along with BESS98 (Sanuki et al. 2000) and BESS-TeV (Haino et al. 2004) data. The lines show the toy-model calculation without the destruction term (thick solid lines) and with it (thick dotted lines). The black, red and blue lines are respectively modulated to Φ = 0 MV (IS), Φ = 591 MV and Φ = 1109. Left panel: same ratio, but as a function of the rigidity. The data are AMS-01 (AMS Collaboration et al. 2002), ATIC (Zatsepin et al. 2003), CAPRICE 94 (Boezio et al. 1999), and some balloon data (Webber et al. 1987). The three toy-model calculations corresponds to the destruction rate set to zero (solid lines) or to its required value (dotted lines), plus a difference in the spectral index of p and He (dashed lines). In both plots, the normalisation is arbitrarily set to match the data.
Current usage metrics show cumulative count of Article Views (full-text article views including HTML views, PDF and ePub downloads, according to the available data) and Abstracts Views on Vision4Press platform.
Data correspond to usage on the plateform after 2015. The current usage metrics is available 48-96 hours after online publication and is updated daily on week days.
Initial download of the metrics may take a while.