| Issue |
A&A
Volume 526, February 2011
|
|
|---|---|---|
| Article Number | A77 | |
| Number of page(s) | 10 | |
| Section | Stellar structure and evolution | |
| DOI | https://doi.org/10.1051/0004-6361/201015848 | |
| Published online | 23 December 2010 | |
RXTE and XMM observations of intermediate polar candidates
1
Department of Physics and AstronomyUniversity of Leicester,
Leicester, LE1 7RH, UK
e-mail: This email address is being protected from spambots. You need JavaScript enabled to view it.
2
Department of Physics and Astronomy, The Open
University, Walton
Hall, Milton Keynes
MK7 6AA,
UK
3
CRESST and X-ray Astrophysics Laboratory NASA/GSFC,
Greenbelt, MD
20771,
USA
4
Department of Physics, University of Maryland,
Baltimore county, 1000 Hilltop
Circle, Baltimore,
MD
21250,
USA
5
Space Sciences Laboratory, 7 Gauss Way, University of California,
Berkeley, CA
94720-7450,
USA
Received: 30 September 2010
Accepted: 21 November 2010
Abstract
Aims. We aim to determine the credentials of nine candidate intermediate polars in order to confirm whether or not they are magnetic cataclysmic variables.
Methods. Frequency analysis of RXTE and XMM data was used to search for temporal variations that could be associated with the spin period of the magnetic white dwarf. X-ray spectral analysis was carried out to characterize the emission and absorption properties of each target.
Results. The hard X-ray light curve of V2069 Cyg shows a pulse period of 743.2 s, and its spectrum is fit by an absorbed bremsstrahlung model with an iron line, confirming this to be a genuine intermediate polar. The hard X-ray light curve of the previously confirmed intermediate polar IGR J00234+6141 is shown to be consistent with the previous low-energy X-ray detection of a 563.5 s pulse period. The likely polar IGR J14536–5522 shows no coherent modulation at the previously identified period of 3.1 h, but does exhibit a clear signal at periods likely to be harmonically related to it. Whilst our RXTE observations of RX J0153.3+7447, Swift J061223.0+701243.9, V436 Car, and DD Cir are largely too faint to give any definitive results, the observations of IGR J16167–4957 and V2487 Oph show some characteristics of intermediate polars, and these objects remain good candidates.
Conclusions. We confirmed one new hard X-ray selected intermediate polar from our sample, V2069 Cyg.
Key words: binaries: general / X-rays: binaries / novae, cataclysmic variables
© ESO, 2010
1. Introduction
Intermediate polars (IPs) are a sub-class of cataclysmic variables (CVs), which have a strong magnetic field on the white dwarf. The strength of the magnetic field is generally believed to be somewhere between that of the non-magnetic CVs and their sister class the polars. This gives an expected range of a few MG to a few tens of MG at the white dwarf surface.
The magnetic field is large enough to dramatically alter the accretion flow, but not large enough to synchronize the spin and orbital periods. This gives rise to flux variations in the optical and X-ray bands pulsed at the spin period (as well as harmonics and beat periods). For a good overview of CVs see e.g. Warner (1995).
There is no formal definition of what characteristics an IP must have to be definitively classed as a genuine member. Common features include coherent optical and X-ray modulations at the white dwarf spin period (and/or at the beat period between the white dwarf spin and orbital periods) and an X-ray spectrum fit by an absorbed bremsstrahlung model, usually with a strong fluorescent iron line at 6.4 keV. The population, and classifications used here are those of Koji Mukai1, and therefore we consider there to be 34 confirmed IPs.
The hard X-ray INTEGRAL mission has found many of the existing population of IPs in its survey (Barlow et al. 2006). This has raised the question of whether the existing population is biased towards being soft X-ray selected. With this in mind we started a programme to identify and characterize hard X-ray selected candidate IPs (Butters et al. 2007, 2008, 2009). The work presented here is the final stage of that process and it presents an investigation of nine more candidate IPs with RXTE and XMM. Most of these objects (i.e. IGR J00234+6141, Swift J061223.0+701243.9, IGR J14536–5522, IGR J16167–4957, V2487 Oph and V2069 Cyg) have been selected on the basis of their hard X-ray emission. However, we also include a few IP candidates (i.e. RX J0153.3+7446, V436 Car and DD Cir) which have had no previous reports of hard X-ray emission, for comparison. Each target has previously been observed in the optical and classed as a likely IP, usually with the X-ray variability missing in order to definitively classify it.
Observing log.
2. Observations and data reduction
Data were obtained from the RXTE satellite (Bradt et al. 1993) with the PCA instrument in cycles 12 and 13. Initial data reduction was done with the standard ftools. Only the top layer of each PCU was included in the measurements, and the time resolution of the data was 16 s. Background-subtracted light curves were constructed in four energy bands: 2–4 keV, 4–6 keV, 6–10 keV and 10–20 keV, as well as a combined 2–10 keV band for maximum signal-to-noise. Each of these was then searched for periodicities using the clean algorithm of Lehto (1997), which iteratively de-convolves the window function from the data. Where a period was found the data were folded at this period and an estimate of modulation depth made.
A mean X-ray spectrum was also extracted, and two simple spectral models fitted to it: a bremsstrahlung and a power law, each absorbed by a single column density of neutral hydrogen. In each case the energy range 5.5–7.5 keV was ignored to achieve a fit to the bulk of the data, then this range was added back in to fit any excess that might be present due to iron line emission. If the fitted spectrum could not fit the Galactic column density well then an interpolated value from Dickey & Lockman (1990) was calculated using the HEASARC nH web interface2, denoted D&L in the text.
RXTE has a large field of view, therefore for each target the ROSAT Bright Source Catalogue was searched for nearby sources. Any sources present had their RXTE count rate estimated with webPIMMS3 and scaled according to their position on the detector.
In the case of IGR J16167−4957 we also present XMM data alongside the RXTE data. The XMM data was taken from an observation made in August 2006 (ObsID 0402920101). The EPIC pn and MOS instruments (Strüder et al. 2001; Turner et al. 2001) accumulated photons in “small window” mode with the medium filter. In addition to the XMM data, we obtained the calibration files indicated as necessary for this observation by the on-line software tool cifbuild. We used the Science Analysis Software (SAS-10.0.0) package to reprocess the pn, MOS1, and MOS2 data using epproc and emproc, yielding photon event lists for the three instruments. Although proton flares sometimes cause portions of XMM observations to have very high backgrounds, we did not find evidence for proton flares, and we were able to use the full exposure time.
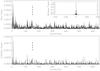 |
Fig. 1 The cleaned power spectrum of the 2–10 keV light curve of J0023. The upper plot shows the raw power spectrum with the window function inset; the lower plot shows the deconvolved (cleaned) power spectrum. The dashed line is at 153 cycles day-1 (563.5 s). |
We used the SAS tool xmmselect to produce XMM energy spectra for IGR J16167–4957. We used standard event filtering and included photons within an aperture with a 30′′ radius. We took background spectra from the nearest source-free region of the CCD. For the MOS detectors, we used the 0.1–10 keV bandpass, and for the pn detector, we used the 0.2–12 keV bandpass.
The observing log can be found in Table 1, and the targets are now presented in order of RA.
3. The candidates
3.1. IGR J00234+6141
This is classified as an “ironclad” IP (according to the IP catalogue version 2009a) with both an established spin and orbital period in the optical (Pspin = 563.5 s and Porb = 14 520 s respectively (Bonnet-Bidaud et al. 2007)). Further to this Anzolin et al. (2009) report XMM observations which clearly show spin modulated X-ray variability below 2 keV, but not above it. No hard X-ray detections of the white dwarf spin period have been reported. Tomsick et al. (2008) report Chandra spectra over a similar energy range.
3.1.1. Observations and results
J0023 was observed over two consecutive days with a total of 41 776 s good time in PCU2 (see Table 1). The 2–10 keV energy band raw count rate varied between 2.0–6.1 ct s-1 and the background count rate was 2.9–4.0 ct s-1. The mean background-subtracted count rate in the 2–10 keV band was 0.7 ct s-1. The cleaned power spectrum of the 2–10 keV RXTE light curve (Fig. 1) has a peak at 153 cycles day-1 (where the 563.5 s spin period would be expected to be seen), however, this is in a forest of peaks, each with a similar power to the “noise” seen elsewhere. The peak at ~10 cycles day-1 is too close to the length of some of the data sets to be considered legitimate here.
The 2–10 keV light curve folded at the previously identified spin period is shown in Fig. 2 where a single peaked modulation is seen. Folding the light curve in different energy bands gives a trend of increasing modulation depth with increasing energy (summarized in Table 2). Folding the data at the 14 520 s orbital period gives an indication of a double peaked modulation, however this is by no means conclusive.
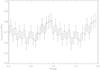 |
Fig. 2 The 2–10 keV background-subtracted light curve of J0023 folded at 563.5 s with an arbitrary zero point. Two cycles are shown. |
Modulation depths of the J0023 light curve folded at 563.5 s.
The parameters of the spectral models used to fit the J0023 X-ray spectrum are shown in Table 3. In both cases the column density had to be pegged to a lower limit. An iron emission line is clearly present and the spectrum is hard, as shown in Fig. 3.
3.1.2. Discussion
The trend of increasing modulation depth with energy is the opposite to what is commonly seen in other IPs, where photoelectric absorption is responsible for much of the modulation. However, the modulation depth of the folded light curves in the 2–4 and 4–6 keV bands is close to being consistent with zero. This is in good agreement with Anzolin et al. (2009) who found no modulation above 2 keV. We note that there is some indication of significant modulation above 6 keV in our data and conclude that this is at least consistent with the previously detected white dwarf spin period.
The spectral properties are quite different from those of Anzolin et al. (2009) and Tomsick et al. (2008), and are hard to explain. However, there is a source near by that may have a comparable count rate to that measured here and which is a likely contaminant in these RXTE data.
We conclude that our RXTE data are consistent with the previous IP classification of J0023, but are unable to shed much further light on its properties.
Spectral fit properties.
3.2. RX J0153.3+7446
J0153 was discovered in the ROSAT all-sky survey and a spin period of 1414 s was suggested (Haberl & Motch 1995). An orbital period of 14 183 s (3.9396 h) has been proposed (priv. comm. cited in Downes et al. 2001) but never published. Norton & Tanner (2006) carried out optical photometry and found strong modulation at a period of 2333 ± 5 s. They also reanalyzed the ROSAT data and concluded that the true spin period is probably 1974 ± 30 s with the 2333 s optical period then being the beat with the 3.9396 h orbital period.
J0153 was observed with RXTE over two consecutive days with a total of 41 376 s good time in PCU2 (see Table 1). The 2–10 keV energy band raw count rate varied between 1.9–5.8 ct s-1 and the background was 2.8–4.1 ct s-1. The mean background-subtracted count rate in this energy band was 0.18 ct s-1.
Figure 4 shows the cleaned power spectrum of the 2–10 keV background-subtracted light curve. No significant peaks are seen, but a peak is present (albeit a small one) at 1974 s (43.8 cycles day-1). However, folding the data at the 1974 s and 2333 s periods yields no significant coherent modulation in either case at each energy band.
Unfortunately, the flux in the background-subtracted X-ray spectrum is too faint to achieve a meaningful fit to the data. Furthermore, there is another X-ray source near by that is likely to have a comparable count rate to that measured here, which Véron-Cetty & Véron (2006) classify as a quasar.
The detection of J0153 in this RXTE observation is therefore sadly too faint to form any definitive conclusion as to its nature.
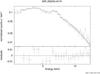 |
Fig. 3 Bremsstrahlung model fit to the 2.5–12 keV spectrum of J0023. |
3.3. Swift J061223.0+701243.9
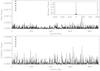 |
Fig. 4 The cleaned power spectrum of the 2–10 keV light curve of J0153. The upper plot shows the raw power spectrum with the window function inset; the lower plot shows the deconvolved (cleaned) power spectrum. The dashed line is at 37 cycles day-1 (2333 s), the dotted line at 44 cycles day-1 (1974 s). |
Very little is known about J0612. It was discovered inside the field of view of a Swift BAT trigger (Grupe et al. 2006a) and was seen to brighten then fade over a period of 58 ks while Swift was observing it. It was later observed again with Swift for ~8 ks to measure a spectrum (Grupe et al. 2006b). The spectrum was modelled by an absorbed power law with Γ = 1.61 ± 0.24 and NH = (1.8 ± 0.8) × 1021 cm-2 and the flux was 3.20 × 10⁻¹² erg cm-2 s-1 in the 0.3–10 keV band. Grupe et al. (2006b) also report low resolution spectra from the Hobby-Eberly-Telescope at McDonald Observatory. The optical spectrum clearly showed strong hydrogen and helium lines, identifying this target as either a low mass X-ray binary or a CV.
J0612 was observed with RXTE over two consecutive days with a total of 39 216 s from PCU2 (see Table 1). The 2–10 keV raw count rate varied between 1.9–5.3 ct s-1 and the background-subtracted count rate had a mean of close to 0.0 ct s-1. The background may therefore be over-subtracted, but in any case the source is at the limit of detectability in this observation.
Figure 5 shows the cleaned power spectrum of the 2–10 keV background-subtracted light curve. Five peaks stand out in the plot, 50 cycles day-1 (1734 ± 9 s), 80 cycles day-1 (1083 ± 4 s), 296 cycles day-1 (292.3 ± 0.3 s), 592 cycles day-1 (146.0 ± 0.1 s), and 626 cycles day-1 (138.0 ± 0.1 s). The 2–10 keV light curve folded at the one of these that is most typical of an IP spin period (i.e. 292.3 s) is shown in Fig. 6. A coherent modulation is seen, but the error bars are large and the profile is consistent with zero modulation (and indeed zero flux).
As with J0153, the background-subtracted spectrum is too faint to obtain a meaningful fit. An uncategorized X-ray source is also in the RXTE field of view, and may contribute a comparable count rate to the target. We also note that J0162 is not found in the ROSAT all sky survey, so is likely to be a transient object. Sadly, given its faintness in this observation, we cannot comment further on its nature.
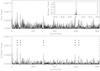 |
Fig. 5 The cleaned power spectrum of the 2–10 keV light curve of J0612. The upper plot shows the raw power spectrum with the window function inset; the lower plot shows the deconvolved (cleaned) power spectrum. The dashed lines represent the five main peaks (see text). |
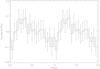 |
Fig. 6 The 2–10 keV background-subtracted light curve of J0612 folded at 292.3 s with an arbitrary zero point. Two cycles are shown. |
3.4. V436 Car
V436 Car (RX J0744.9−5257) was identified as a CV by Motch et al. (1996) in the ROSAT all-sky survey. Ramsay et al. (1998) carried out optical and X-ray analysis of the object, concluding it was a likely IP. They found a probable orbital period of 3.60 h from optical spectrometry along with several other candidate periods from aliases and their photometry. Woudt & Warner (2002) carried out high speed photometry of V436 Car, concluding the true period was in fact 4.207 h, an alias of the period seen by Ramsay et al. (1998).
V436 Car was observed with RXTE over two consecutive days with a total of 27 456 s good time in PCU2 (see Table 1). The 2–10 keV energy band raw count rate varied between 2.3–7.3 ct s-1, and the background count rate was 0–4.2 ct s-1. The mean background-subtracted count rate in the 2–10 keV band was 0.43 ct s-1. The data is stable over the run with no obvious flaring events.
Figure 7 shows the cleaned power spectrum of the 2–10 keV background-subtracted light curve. The largest peak is at ~14 cycles day-1 (1.706 ± 0.025 h). None of the orbital periods found by Ramsay et al. (1998) or Woudt & Warner (2002) have been found here and no significant coherent modulation that is commensurate with a spin period is seen here either. This agrees with the lack of detection in the previous studies in both the optical and X-ray.
The X-ray spectrum of V436 Car is relatively poorly fit with both models (see Table 3) and shows no sign of an iron emission line. There is another source in the RXTE field of view, but it is sufficiently faint and far from the centre that it should not affect this result.
Given the lack of coherent modulation and absence of an iron line in the spectrum, it is unlikely that V436 Car is an IP.
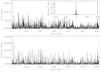 |
Fig. 7 The cleaned power spectrum of the 2–10 keV light curve of V436 Car. The upper plot shows the raw power spectrum with the window function inset; the lower plot shows the deconvolved (cleaned) power spectrum. |
3.5. DD Cir
DD Cir was first discovered as a nova with an apparent magnitude of 7.7 (Liller et al. 1999). Woudt & Warner (2003) subsequently carried out high speed photometry using the 74-inch telescope at the SAAO and their run yielded an average magnitude (not standardized) of ~20. They found DD Cir to be an eclipsing system with an orbital period of 2.339 h, and concluded it had an inclination of 79°. Further to this, Woudt & Warner (2003) found distinct periodic signals in three individual nights’ FTs which were consistent within errors, at ~670 s.
Data was collected with RXTE over just over one day (see Table 1). The total good time on target was 49 212 s in PCU2. The raw target count rate varied between 3.5 and 8.3 ct s-1 and the background was 4.5–6.7 ct s-1. The mean background-subtracted rate was 0.1 ct s-1 in the 2–10 keV band.
Figure 8 shows the cleaned power spectrum of the background-subtracted 2–10 keV light curve. Two strong peaks are present in the plot, one at ~165 cycles day-1 (525 ± 1 s) and the other at ~15 cycles day-1 (5574 ± 120 s). The 2–10 keV light curve folded at the shorter period is shown in Fig. 9 where a coherent modulation is seen, which is nonetheless also consistent with a constant flux. Unfortunately the target is too faint to construct meaningful light curves in different energy bands to investigate any variation in modulation depth with energy.
The X-ray spectrum of this source is also too faint to obtain a meaningful model fit. There is a pre-main sequence star in the RXTE field of view, but its position in the detector means it should contribute no more than 1/4 of the total count rate.
The possible modulation seen at 525 s means that DD Cir may be an IP, but a more sensitive detector is needed to prove the case either way.
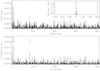 |
Fig. 8 The cleaned power spectrum of the 2–10 keV light curve of DD Cir. The upper plot shows the raw power spectrum with the window function inset; the lower plot shows the deconvolved (cleaned) power spectrum. The dashed line is at 15.5 cycles day-1, the dotted line at 165 cycles day-1. |
3.6. IGR J14536−5522
J1453 was discovered as a hard X-ray source with INTEGRAL (Kuiper et al. 2006). Soon afterwards it was observed with the Swift BAT and found to be a relatively hard source with kT ~ 30−40 keV for a single temperature Bremsstrahlung fit, exhibiting variability (Mukai et al. 2006). Pointed Swift XRT observations gave a flux of 3.3 × 10⁻¹¹ erg cm-2 s-1 at 0.4–10 keV, and revealed a complex spectrum requiring at least two components to fit the data (Mukai et al. 2006). Masetti et al. (2006b) used the CTIO 1.5 m telescope to get optical spectroscopy of J1453, on the basis of the Balmer and HeI lines they classified it as a CV. Optical spectroscopy obtained from the SALT in 2006 exhibits a clear modulation at 3.1565(1) h, but SAAO 1.9 m optical photometry does not (Potter et al. 2010). After these data were taken, optical circular polarization from the source was discovered to be modulated at the orbital period, which provided a strong indication that J1453 is a polar (Potter et al. 2010).
3.6.1. Observations and results
RXTE data were collected over the course of just over one day (see Table 1). The total good time on target (31 320 s) was split into 13 segments in PCU2. The raw target count rate varied between 4.3 and 11.2 ct s-1 and the raw background (generated from the calibration files) was between 2.7 and 4.1 ct s-1.
When the background-subtracted 2–10 keV light curve was analyzed with the clean algorithm, no evidence of any periodicity at the 3.1 h (11 363 s) spectroscopic period was seen. However, three periods are evident: 3746 ± 110 s, 7202 ± 220 s and 15 594 ± 1123 s (see Fig. 10). These values are potentially a period and its first and third harmonics (within uncertainties). Figure 11 shows a plot of the data folded at the 3746 s period. There is some indication of a trend in the modulation depth of the folded light curves of each potential period to decrease with increasing energy (see Table 4), but the trend is only marginally significant.
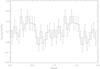 |
Fig. 9 The background-subtracted 2–10 kev light curve of DD Cir folded at 525 s. The zero point on the time axis is the time of the first observation. |
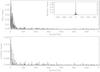 |
Fig. 10 The cleaned power spectrum of the 2–10 keV light curve of J1453. The upper plot shows the raw power spectrum with the window function inset; the lower plot shows the deconvolved (cleaned) power spectrum. |
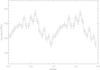 |
Fig. 11 The 2–10 keV background-subtracted light curve of J1453 folded at 3746 s, with an arbitrary zero point. Two periods are shown for clarity. |
Modulation depths of the folded light curves of J1453, in different energy bands and at each of the potential periods.
Fitting models to the J1453 X-ray spectrum required the column density be pegged to a
lower limit of the Galactic column density for the Bremsstrahlung fit. The best fit was
the power law fit, yielding a  (see Fig. 12 and also Table 3).
3.6.2. Discussion
The peaks in the power spectrum of J1453 are not typical of spin periods in IPs. The shortest period corresponding to the peaks seen is 3746 ± 110 s, which would make it one of the longest spin periods of the IPs. This period is also not seen in the optical data. As such the evidence for this as a spin period is weak. The same is true for the 7202 s and 15 594 s peaks. The lack of any strong spin period candidates implies that J1453 is probably not an IP.
In the absence of previous observations, these periods would be potential candidates for the orbital period of the system. In fact the reported orbital period (3.1565 h = 11 360 s) is close to what would be the second harmonic of 3746 s, with the two longer periods seen being further (sub-)harmonics. The uncertainties on these periods are relatively large however, and the correspondence may jut be a coincidence. A longer base line in the X-ray data would constrain this period further and conclusively show if this was real.
The spectral profiles indicated a photoelectrically absorbed power law plus iron line
was the preferred fit, although the Bremsstrahlung fit was also acceptable, with a
slightly higher  . Both fits are consistent with a
magnetic CV interpretation, with the clear detection of an iron emission line.
. Both fits are consistent with a
magnetic CV interpretation, with the clear detection of an iron emission line.
The flux seen here is significantly higher than previously measured −4.1 × 10⁻¹¹ erg cm-2 s-1 in the 2–10 keV energy band as opposed to 3.3 × 10⁻¹¹ erg cm-2 s-1 at 0.4–10 keV reported previously. There is one other X-ray source in the RXTE field of view of J1453 with an estimated count rate of 0.96 ct s-1 PCU-1. This other source has also been detected with INTEGRAL and therefore is a hard X-ray source too. This may affect the spectrum in a complex way that we cannot characterize here.
3.7. IGR J16167−4957
IGR J16167−4957 (J1616) was discovered as a hard X-ray source in the INTEGRAL/IBIS survey (Barlow et al. 2006). Soon after this Tomsick et al. (2006) constrained the position of J1616 with Chandra data and concluded it was not an HMXB. At the same time Masetti et al. (2006a) identified J1616 as a CV in their optical spectroscopy campaign to identify INTEGRAL objects.
Pretorius (2009) reported a 5.004 h (18 014 s) orbital period seen in optical spectroscopy, but no persistent coherent modulation in high-speed photometry. A 585 s modulation was seen in some of Pretorius (2009) data, but not all, so is therefore likely a QPO.
3.7.1. Observations and results
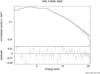 |
Fig. 12 2.5–20 keV mean spectrum of J1453 fitted with a photoelectrically absorbed power law plus iron line profile. |
J1616 was observed with RXTE over two consecutive days (see Table 1). The total good time was 34 864 s in PCU2. The 2–10 keV energy band raw count rate varied between 5.4–14.8 ct s-1, and the background rate was 2.8–4.1 ct s-1. The average background-subtracted count rate was 5.2 ct s-1. The ROSAT Bright Source Catalog has one other object in the RXTE field of view at approximately half a degree from J1616, which has twice the ROSAT count rate. This is likely to be a significant source of contamination in our observation. For this reason we also used archived XMM data to better constrain this source.
Figure 13 shows the cleaned power spectrum of the 2–10 keV RXTE background-subtracted light curve of J1616. There are no significant peaks in the plot that are commensurate with a potential spin period. This was also the case in the XMM data. The largest peak is at a period of 10.2 ± 1.3 h.
Figure 14 shows the XMM-EPIC spectrum of J1616 in the range 0.2–10 keV. A power law with two partial covering absorbers gave the best fit to the data. Three Gaussians were also included in the fit to model the iron line features. Further to this an OVII edge was added at 0.7393 keV. The fit parameters are shown in Table 5.
Power law fit with two partial covering absorbers and three Gaussians of J1616.
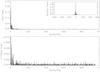 |
Fig. 13 The cleaned power spectrum of the 2–10 keV light curve of J1616. The upper plot shows the raw power spectrum with the window function inset; the lower plot shows the deconvolved (cleaned) power spectrum. |
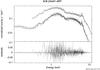 |
Fig. 14 0.2–10 keV mean spectrum of J1616 fitted with two partial covering absorbers and a power law with iron line profiles. The upper data is the pn-data and the lower the two MOS data sets. |
3.7.2. Discussion
There is no candidate period in the power spectrum that indicates a coherent modulation associated with a potential spin period and the 585 s (~148 cycles day-1) QPO seen by Pretorius (2009) is not seen here either. The 10.2 h peak that we see is at roughly twice the orbital period reported by Pretorius (2009), however the uncertainty here is relatively large, so this may be coincidence.
The spectrum is fairly typical of IPs and suggests a power law with a partial covering
absorber with iron line features. Further to this, the detection of the OVII
edge implies the existence of a warm absorber – likely the pre-shock flow being
photoionized. This has been seen in two other IPs (V1223 Sgr, Mukai et al. 2001; and 1RXS J173021.5-055933, de Martino et al. 2008) and further adds to the case for IP
classification. It should be noted that two other models gave only a slightly worse
fit–two partial covering absorbers on an apec+apec model and a power law
distribution of covering fractions (pwab) on a mkcflow.
 and 1.06 respectively.
The optical spectra taken by Masetti et al. (2006a) and Pretorius (2009) along with the X-ray spectrum seen here point towards an IP classification of J1616. However, the lack of any feasible spin period candidate in either the optical or X-ray means that the classification cannot be confirmed. Perhaps the geometry of the accretion column is such that the magnetic and spin axis are aligned (or very nearly aligned), so no spin modulation would be seen, as discussed by Ramsay et al. (2008).
The IP classification of J1616 is thus unproven, though it remains as a candidate system.
3.8. V2487 Oph
V2487 Oph was discovered in the optical as a possible nova in 1998 at magnitude 9.5 (Nakano et al. 1998). Lynch et al. (2000) showed a plot of the rapid decline in visual magnitude (courtesy of the AAVSO), indicating V2487 Oph was a very fast nova. They also presented NIR spectra, showing an overabundance in carbon soon after the outburst. Hachisu et al. (2002) modelled the optical light curve and concluded it has a WD mass of 1.35 ± 0.01 M⊙, and the mass transfer rate indicated a recurrence period of about 40 years. Hernanz & Sala (2002) reported XMM data of V2487 Oph taken 2.7 years after its discovery. They fit their spectrum with a two-temperature plasma model (Tlow = 0.2 keV and Thigh ≥ 48 keV), which suggests a shocked gas (due to an accretion flow) was present. They also find an iron line at 6.4 keV. The error circles of V2487 Oph and 1RXS J173200.0–191349 are coincident, and the XMM and ROSAT fluxes are similar, indicating they may be the same source. V2487 Oph was then found in the INTEGRAL/IBIS survey (Barlow et al. 2006). Pagnotta et al. (2009) searched archival data for previous eruptions and found one occurred in 1900, confirming V2487 Oph as a recurrent nova.
3.8.1. Observations and results
V2487 Oph was observed by RXTE over two consecutive days (see Table 1). The total good time was 42 312 s in PCU2. The 2–10 keV energy band raw count rate varied between 2.8–6.3 ct s-1, and the background count rate (generated from the calibration files) 0–2.8 ct s-1. The average background-subtracted count rate was 1.1 ct s-1. There is another X-ray source in the field of view that we would expect to contribute a comparable count rate to V2487 Oph.
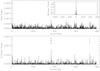 |
Fig. 15 The cleaned power spectrum of the 2–10 keV light curve of V2487 Oph. The upper plot shows the raw power spectrum with the window function inset; the lower plot shows the deconvolved (cleaned) power spectrum. The dashed line is at 367 cycles day-1, the dotted line at 727 cycles day-1. |
Figure 15 shows the cleaned power spectrum of the background-subtracted 2–10 keV light curve. The largest peak is at approximately 367 cycles day-1 (235.2 ± 0.1 s), the second largest peak is at 118.9 ± 0.1 s – very close (but not within errors) of being a potential first harmonic of the 235.2 peak. The folded data (in all bands) shows only marginally coherent modulation, and as such we do not consider the 235.2 s peak to be a secure period, merely a candidate.
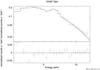 |
Fig. 16 2.5–12 keV mean spectrum of V2487 Oph fitted with a photoelectrically absorbed power law plus iron line profile. |
The mean X-ray spectrum was fitted with both a photoelectrically absorbed bremsstrahlung and an absorbed power law, with an iron emission line in each case, over the range 2.5–12 keV. The results are summarized in Table 3. The column density was pegged to a lower limit of 2 × 1021 cm-2 (D&L). Figure 16 shows the power law fit. The 2–10 keV flux of the fit was 1.2 × 10⁻¹¹ erg cm-2 s-1.
3.8.2. Discussion
The lack of any significant coherent modulation is unsurprising given the recent nova eruption. It may be some time before the system settles down to a state where modulation can be seen from the accretion column (if this ever does happen). The spectrum is indicative of an IP, with a strong iron line. There is however an excess at lower energies which skews the model fits, this may be from residual nuclear burning after the nova, or from the more traditional soft X-ray source in IPs. The flux is approximately three times higher than that in Hernanz & Sala (2002), but this is in a sightly different energy band to theirs (0.3–8 keV), and as noted earlier there is another source in the field of view.
V2487 Oph therefore remains as a candidate IP until it reaches a more stable state at which point the presence of periodicities can be probed further.
3.9. V2069 Cyg
V2069 Cyg (RX J2123.7+4217) was identified as a CV by Motch et al. (1996) in the ROSAT all-sky survey and Thorstensen & Taylor (2001) measured an orbital period of 0.311683(2) days (7.480 h) from optical spectroscopy. Barlow et al. (2006) subsequently found V2069 Cyg in their INTEGRAL/IBIS survey. de Martino et al. (2009) reported preliminary analysis of XMM data of V2069 Cyg in an ATel, where they find a fundamental frequency of 116.3 cycles day-1 and its harmonics, giving a period of 743.2 ± 0.4 s. They also give a fit to the spectrum of a 16 keV thermal plasma with a 56 eV blackbody component and a Gaussian at 6.4 keV, being absorbed by a partially covering model.
3.9.1. Observations and results
V2069 Cyg was observed with RXTE over two consecutive days (see Table 1). The total good time was 37 472 s in PCU2. The 2–10 keV energy band raw count rate varied between 2.6–6.2 ct s-1, and the background count rate (generated from the calibration files) was 0–4.2 ct s-1. The average background-subtracted count rate was 1.1 ct s-1. There is one other source in the RXTE field of view of V2069 Cyg, but it is at the very edge of the detector, and is also very faint, and so is ignored here.
Figure 17 shows the cleaned power spectrum of the background-subtracted 2–10 keV light curve. Peaks are seen at approximately 115 cycles day-1, 230 cycles day-1 and 350 cycles day-1. If these correspond to the fundamental and first and second harmonics, then this implies a period of 743.2 ± 0.9 s.
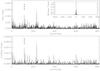 |
Fig. 17 The cleaned power spectrum of the 2–10 keV light curve of V2069 Cyg. The upper plot shows the raw power spectrum with the window function inset; the lower plot shows the deconvolved (cleaned) power spectrum. The dashed line is at 116 cycles day (743 s). |
The 2–10 keV light curve folded at 743.2 s is shown in Fig. 18. A clear double peak modulation is present – as expected from the harmonic structure seen in the power spectrum. Folding the light curve in each energy band at this period and analysing the modulation depth shows that there is a trend of an increasing modulation depth with decreasing energy (see Table 6). There is no coherent modulation in the light curves when folded at the 7.48 h spectroscopic orbital period of Thorstensen & Taylor (2001).
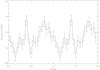 |
Fig. 18 The 2–10 keV light curve of V2069 Cyg folded at 743.2 s with an arbitrary zero point. Two periods are shown. |
Modulation depths of the V2069 Cyg X-ray light curve folded at 743.2 s.
The mean X-ray spectrum was fitted with both a photoelectrically absorbed bremsstrahlung and an absorbed power law, with an iron emission line in each case, over the range 2.5–20 keV. The results are summarized in Table 3. The column density was pegged to a lower limit of 3.3 × 1021 cm-2 (D&L). Figure 19 shows the bremsstrahlung fit. The 2–10 keV flux of the fit was 1.2 × 10⁻¹¹ erg cm-2 s-1.
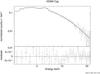 |
Fig. 19 2.5–20 keV mean spectrum of V2069 Cyg fitted with a photoelectrically absorbed Bremsstrahlung plus iron line profile. |
3.9.2. Discussion
We interpret the period seen here (743.2 ± 0.9 s) as the spin period of the white dwarf in V2069 Cyg. This is in very good agreement with the preliminary analysis of de Martino et al. (2009) who find a 743.2 ± 0.4 s period. Furthermore, the trend of decreasing modulation depth with increasing X-ray energy is similar to that commonly seen in other IPs, and indicates that photoelectric absorption is a major contributor to the modulation. The hard X-ray spectrum seen here, with an iron line at 6.4 keV is typical of IPs.
Given the spin period modulation, the trend in the modulation depth and the spectral fit, V2069 Cyg is therefore confirmed as an intermediate polar.
4. Conclusion
V2069 Cyg is conclusively proven here to be an intermediate polar with a white dwarf spin period of 743.2 s and a characteristic hard X-ray spectrum with an iron line. Our data are consistent with the previous claims for J0023 to be an intermediate polar, but do not add further to the information about the object. Likewise, our data are consistent with the polar interpretation of J1453, revealing hard X-ray signals that are likely to be harmonically related to the previously detected orbital period. The RXTE observations of J0153, J0162, V436 Car and DD Cir are each essentially too faint to allow further conclusions to be drawn. Although we see tentative evidence for a 292 s pulsation in J0162 and a 525 s pulsation in DD Cir, no coherent X-ray pulsations are conclusively detected in any of these four objects. Finally, our observations of J1616 and V2487 Oph reveal X-ray spectra that are characteristic of an IP, but no coherent X-ray pulsations are seen, so these objects remain candidate IPs. We speculate that perhaps these systems may have their magnetic axis aligned with their spin axis. This could account for the lack of significant coherent spin modulation while still allowing the spectral properties seen here.
INTEGRAL found several IPs in its initial survey and this was largely a surprise to the CV community. Since then it has found many more as well as finding many candidate IPs. Follow
up of these candidates with ground based optical telescopes has revealed periods in some cases, and spectra in most cases that are commensurate with an IP classification. X-ray classification is an integral part of this process, and the work done in this campaign with RXTE, and that done by others with XMM has beeninvaluable. With the follow-up of all IP candidates discovered by INTEGRAL now nearing completion, it may be that we have now found virtually all the hard X-ray selected IPs that are bright enough to observe with current instrumentation.
http://asd.gsfc.nasa.gov/Koji.Mukai/iphome/iphome.html (IP catalogue version 2009a).
References
- Anzolin, G., de Martino, D., Falanga, M., et al. 2009, A&A, 501, 1047 [NASA ADS] [CrossRef] [EDP Sciences] [Google Scholar]
- Barlow, E. J., Knigge, C., Bird, A. J., et al. 2006, MNRAS, 372, 224 [NASA ADS] [CrossRef] [Google Scholar]
- Bonnet-Bidaud, J. M., de Martino, D., Falanga, M., Mouchet, M., & Masetti, N. 2007, A&A, 473, 185 [NASA ADS] [CrossRef] [EDP Sciences] [Google Scholar]
- Bradt, H. V., Rothschild, R. E., & Swank, J. H. 1993, A&AS, 97, 355 [NASA ADS] [Google Scholar]
- Butters, O. W., Barlow, E. J., Norton, A. J., & Mukai, K. 2007, A&A, 475, L29 [NASA ADS] [CrossRef] [EDP Sciences] [Google Scholar]
- Butters, O. W., Norton, A. J., Hakala, P., Mukai, K., & Barlow, E. J. 2008, A&A, 487, 271 [NASA ADS] [CrossRef] [EDP Sciences] [Google Scholar]
- Butters, O. W., Norton, A. J., Mukai, K., & Barlow, E. J. 2009, A&A, 498, L17 [NASA ADS] [CrossRef] [EDP Sciences] [Google Scholar]
- de Martino, D., Matt, G., Mukai, K., et al. 2008, A&A, 481, 149 [NASA ADS] [CrossRef] [EDP Sciences] [Google Scholar]
- de Martino, D., Bonnet-Bidaud, J. M., Falanga, M., Mouchet, M., & Motch, C. 2009, The Astronomer’s Telegram, 2089, 1 [NASA ADS] [Google Scholar]
- Dickey, J. M., & Lockman, F. J. 1990, ARA&A, 28, 215 [NASA ADS] [CrossRef] [MathSciNet] [Google Scholar]
- Downes, R. A., Webbink, R. F., Shara, M. M., et al. 2001, PASP, 113, 764 [NASA ADS] [CrossRef] [Google Scholar]
- Grupe, D., Burrows, D., Morris, D., et al. 2006a, GRB Coordinates Network, 4681, 1 [NASA ADS] [Google Scholar]
- Grupe, D., Osborne, J. P., Page, K. L., et al. 2006b, The Astronomer’s Telegram, 775, 1 [NASA ADS] [Google Scholar]
- Haberl, F., & Motch, C. 1995, A&A, 297, L37 [NASA ADS] [Google Scholar]
- Hachisu, I., Kato, M., Kato, T., & Matsumoto, K. 2002, in The Physics of Cataclysmic Variables and Related Objects, ed. B. T. Gänsicke, K. Beuermann, & K. Reinsch, ASP Conf. Ser., 261, 629 [Google Scholar]
- Hernanz, M., & Sala, G. 2002, Science, 298, 393 [NASA ADS] [CrossRef] [PubMed] [Google Scholar]
- Kuiper, L., Keek, S., Hermsen, W., Jonker, P. G., & Steeghs, D. 2006, The Astronomer’s Telegram, 684, 1 [Google Scholar]
- Lehto, H. J. 1997, in Applications of time series analysis in astronomy and meteorology, ed. T. Subba Rao, M. B. Priestley, & O. Lessi (London Chapman and Hall) [Google Scholar]
- Liller, W., Pearce, A., Stubbings, R., & Jones, A. 1999, IAU Circ., 7242, 1 [NASA ADS] [Google Scholar]
- Lynch, D. K., Rudy, R. J., Mazuk, S., & Puetter, R. C. 2000, ApJ, 541, 791 [NASA ADS] [CrossRef] [Google Scholar]
- Masetti, N., Morelli, L., Palazzi, E., et al. 2006a, A&A, 459, 21 [Google Scholar]
- Masetti, N., Morelli, L., Palazzi, E., et al. 2006b, The Astronomer’s Telegram, 783, 1 [Google Scholar]
- Motch, C., Haberl, F., Guillout, P., et al. 1996, A&A, 307, 459 [NASA ADS] [Google Scholar]
- Mukai, K., Kallman, T., Schlegel, E., et al. 2001, in New Century of X-ray Astronomy, ed. H. Inoue, & H. Kunieda, ASP Conf. Ser., 251, 90 [Google Scholar]
- Mukai, K., Markwardt, C. B., Tueller, J., et al. 2006, The Astronomer’s Telegram, 686, 1 [NASA ADS] [Google Scholar]
- Nakano, S., Takamizawa, K., Kushida, Y., & Kato, T. 1998, IAU Circ., 6941, 1 [NASA ADS] [Google Scholar]
- Norton, A. J., & Tanner, J. D. 2006, A&A, 447, L17 [NASA ADS] [CrossRef] [EDP Sciences] [Google Scholar]
- Pagnotta, A., Schaefer, B. E., Xiao, L., Collazzi, A. C., & Kroll, P. 2009, AJ, 138, 1230 [NASA ADS] [CrossRef] [Google Scholar]
- Potter, S. B., Buckley, D. A. H., O’Donoghue, D., et al. 2010, MNRAS, 402, 1161 [NASA ADS] [CrossRef] [Google Scholar]
- Pretorius, M. L. 2009, MNRAS, 395, 386 [NASA ADS] [CrossRef] [Google Scholar]
- Ramsay, G., Buckley, D. A., & Cropper, M. 1998, MNRAS, 294, 187 [NASA ADS] [CrossRef] [Google Scholar]
- Ramsay, G., Wheatley, P. J., Norton, A. J., Hakala, P., & Baskill, D. 2008, MNRAS, 387, 1157 [NASA ADS] [CrossRef] [Google Scholar]
- Strüder, L., Briel, U., Dennerl, K., et al. 2001, A&A, 365, L18 [NASA ADS] [CrossRef] [EDP Sciences] [Google Scholar]
- Thorstensen, J. R., & Taylor, C. J. 2001, MNRAS, 326, 1235 [NASA ADS] [CrossRef] [Google Scholar]
- Tomsick, J. A., Chaty, S., Rodriguez, J., et al. 2006, ApJ, 647, 1309 [NASA ADS] [CrossRef] [Google Scholar]
- Tomsick, J. A., Chaty, S., Rodriguez, J., Walter, R., & Kaaret, P. 2008, ApJ, 685, 1143 [Google Scholar]
- Turner, M. J. L., Abbey, A., Arnaud, M., et al. 2001, A&A, 365, L27 [NASA ADS] [CrossRef] [EDP Sciences] [Google Scholar]
- Véron-Cetty, M., & Véron, P. 2006, A&A, 455, 773 [NASA ADS] [CrossRef] [EDP Sciences] [Google Scholar]
- Warner, B. 1995, Cataclysmic variable stars, Cambridge Astrophysics Series (Cambridge, New York: Cambridge University Press) [Google Scholar]
- Woudt, P. A., & Warner, B. 2002, MNRAS, 335, 44 [NASA ADS] [CrossRef] [Google Scholar]
- Woudt, P. A., & Warner, B. 2003, MNRAS, 340, 1011 [NASA ADS] [CrossRef] [Google Scholar]
All Tables
Modulation depths of the folded light curves of J1453, in different energy bands and at each of the potential periods.
All Figures
|
Fig. 1 The cleaned power spectrum of the 2–10 keV light curve of J0023. The upper plot shows the raw power spectrum with the window function inset; the lower plot shows the deconvolved (cleaned) power spectrum. The dashed line is at 153 cycles day-1 (563.5 s). |
| In the text | |
|
Fig. 2 The 2–10 keV background-subtracted light curve of J0023 folded at 563.5 s with an arbitrary zero point. Two cycles are shown. |
| In the text | |
|
Fig. 3 Bremsstrahlung model fit to the 2.5–12 keV spectrum of J0023. |
| In the text | |
|
Fig. 4 The cleaned power spectrum of the 2–10 keV light curve of J0153. The upper plot shows the raw power spectrum with the window function inset; the lower plot shows the deconvolved (cleaned) power spectrum. The dashed line is at 37 cycles day-1 (2333 s), the dotted line at 44 cycles day-1 (1974 s). |
| In the text | |
|
Fig. 5 The cleaned power spectrum of the 2–10 keV light curve of J0612. The upper plot shows the raw power spectrum with the window function inset; the lower plot shows the deconvolved (cleaned) power spectrum. The dashed lines represent the five main peaks (see text). |
| In the text | |
|
Fig. 6 The 2–10 keV background-subtracted light curve of J0612 folded at 292.3 s with an arbitrary zero point. Two cycles are shown. |
| In the text | |
|
Fig. 7 The cleaned power spectrum of the 2–10 keV light curve of V436 Car. The upper plot shows the raw power spectrum with the window function inset; the lower plot shows the deconvolved (cleaned) power spectrum. |
| In the text | |
|
Fig. 8 The cleaned power spectrum of the 2–10 keV light curve of DD Cir. The upper plot shows the raw power spectrum with the window function inset; the lower plot shows the deconvolved (cleaned) power spectrum. The dashed line is at 15.5 cycles day-1, the dotted line at 165 cycles day-1. |
| In the text | |
|
Fig. 9 The background-subtracted 2–10 kev light curve of DD Cir folded at 525 s. The zero point on the time axis is the time of the first observation. |
| In the text | |
|
Fig. 10 The cleaned power spectrum of the 2–10 keV light curve of J1453. The upper plot shows the raw power spectrum with the window function inset; the lower plot shows the deconvolved (cleaned) power spectrum. |
| In the text | |
|
Fig. 11 The 2–10 keV background-subtracted light curve of J1453 folded at 3746 s, with an arbitrary zero point. Two periods are shown for clarity. |
| In the text | |
|
Fig. 12 2.5–20 keV mean spectrum of J1453 fitted with a photoelectrically absorbed power law plus iron line profile. |
| In the text | |
|
Fig. 13 The cleaned power spectrum of the 2–10 keV light curve of J1616. The upper plot shows the raw power spectrum with the window function inset; the lower plot shows the deconvolved (cleaned) power spectrum. |
| In the text | |
|
Fig. 14 0.2–10 keV mean spectrum of J1616 fitted with two partial covering absorbers and a power law with iron line profiles. The upper data is the pn-data and the lower the two MOS data sets. |
| In the text | |
|
Fig. 15 The cleaned power spectrum of the 2–10 keV light curve of V2487 Oph. The upper plot shows the raw power spectrum with the window function inset; the lower plot shows the deconvolved (cleaned) power spectrum. The dashed line is at 367 cycles day-1, the dotted line at 727 cycles day-1. |
| In the text | |
|
Fig. 16 2.5–12 keV mean spectrum of V2487 Oph fitted with a photoelectrically absorbed power law plus iron line profile. |
| In the text | |
|
Fig. 17 The cleaned power spectrum of the 2–10 keV light curve of V2069 Cyg. The upper plot shows the raw power spectrum with the window function inset; the lower plot shows the deconvolved (cleaned) power spectrum. The dashed line is at 116 cycles day (743 s). |
| In the text | |
|
Fig. 18 The 2–10 keV light curve of V2069 Cyg folded at 743.2 s with an arbitrary zero point. Two periods are shown. |
| In the text | |
|
Fig. 19 2.5–20 keV mean spectrum of V2069 Cyg fitted with a photoelectrically absorbed Bremsstrahlung plus iron line profile. |
| In the text | |
Current usage metrics show cumulative count of Article Views (full-text article views including HTML views, PDF and ePub downloads, according to the available data) and Abstracts Views on Vision4Press platform.
Data correspond to usage on the plateform after 2015. The current usage metrics is available 48-96 hours after online publication and is updated daily on week days.
Initial download of the metrics may take a while.