Fig. 4
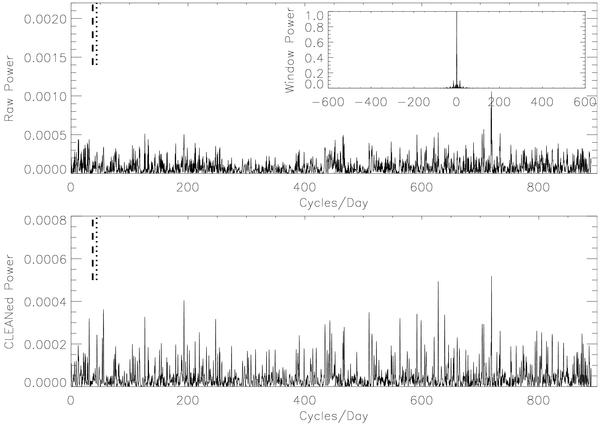
The cleaned power spectrum of the 2–10 keV light curve of J0153. The upper plot shows the raw power spectrum with the window function inset; the lower plot shows the deconvolved (cleaned) power spectrum. The dashed line is at 37 cycles day-1 (2333 s), the dotted line at 44 cycles day-1 (1974 s).
Current usage metrics show cumulative count of Article Views (full-text article views including HTML views, PDF and ePub downloads, according to the available data) and Abstracts Views on Vision4Press platform.
Data correspond to usage on the plateform after 2015. The current usage metrics is available 48-96 hours after online publication and is updated daily on week days.
Initial download of the metrics may take a while.