Fig. 1
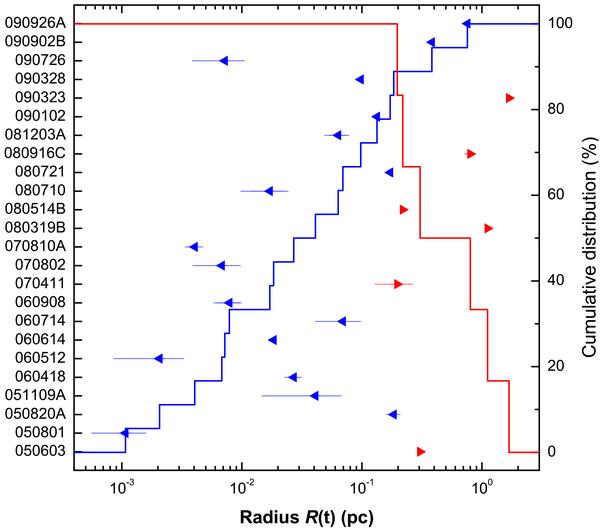
Shown here are lower (to-the-right pointing triangles) and upper (to-the-left pointing triangles) limits on the position of the wind termination shock based on Eq. (1), assuming A ⋆ = 1 in all cases (Table 3). Note that GRB 060614 is a much debated burst (see Sect. 3.1.1). The step curves are the cumulative distributions to the lower limits up to which a wind profile is identified and upper limits after which a constant density medium (ISM) agrees with the data.
Current usage metrics show cumulative count of Article Views (full-text article views including HTML views, PDF and ePub downloads, according to the available data) and Abstracts Views on Vision4Press platform.
Data correspond to usage on the plateform after 2015. The current usage metrics is available 48-96 hours after online publication and is updated daily on week days.
Initial download of the metrics may take a while.