| Issue |
A&A
Volume 526, February 2011
|
|
|---|---|---|
| Article Number | A15 | |
| Number of page(s) | 6 | |
| Section | Stellar structure and evolution | |
| DOI | https://doi.org/10.1051/0004-6361/201014954 | |
| Published online | 14 December 2010 | |
Unveiling the nature of IGR J16283−4838⋆
1
Instituto de Astronomía y Física del Espacio,
C.C. 67, Suc. 28, (1428),
Buenos Aires,
Argentina
e-mail: This email address is being protected from spambots. You need JavaScript enabled to view it.
2 Consejo Nacional de Investigaciones Científicas y Tećnicas
(CONICET), Argentina
3
Laboratoire AIM (UMR 7158 CEA/DSM-CNRS-Université Paris Diderot)
Irfu/Service d’Astrophysique, Centre de Saclay, Bât. 709, 91191
Gif-sur-Yvette Cedex,
France
Received: 7 May 2010
Accepted: 14 September 2010
Abstract
Context. One of the most striking discoveries of the INTEGRAL observatory is the existence of a previously unknown population of X-ray sources in the inner arms of the Galaxy. The investigations of the optical/NIR counterparts of some of them have provided evidence that they are highly absorbed high mass X-ray binaries hosting supergiants.
Aims. We aim to identify the optical/NIR counterpart of one of the newly discovered INTEGRAL sources, IGR J16283−4838, and determine the nature of this system.
Methods. We present optical and NIR observations of the field of IGR J16283−4838, and use the astrometry and photometry of the sources within it to identify its counterpart. We obtain its NIR spectrum, and its optical/NIR spectral energy distribution by means of broadband photometry. We search for the intrinsic polarization of its light, and its short and long-term photometric variability.
Results. We demonstrate that this source is a highly absorbed HMXB located beyond the Galactic center, and that it may be surrounded by a variable circumstellar medium.
Key words: X-rays: binaries / X-rays: individuals: IGR J16283 / 4838
Based on observations collected at the European Southern Observatory, Chile, under proposal ESO 075.D-0634.
Current address: Department of Astrophysical Sciences, Princeton University, Princeton, NJ 08544, USA.
© ESO, 2010
1. Introduction
A population of new X-ray sources has been discovered by the INTEGRAL observatory within a few tens of degrees of the direction to the Galactic center (Negueruela 2004; Kuulkers 2005). These sources display hard X-ray spectra, which are usually attributed to strong absorption by dense material lying close to the source. Their continuum spectral parameters are typical of systems containing neutron stars or black holes. They are suspected to be high mass X-ray binaries (HMXBs) embedded in highly absorbing media, and for some of them massive companions were indeed identified (e.g., Filliatre & Chaty 2004; Negueruela et al. 2005; 2006; Smith et al. 2006; Masetti et al. 2006; Pellizza et al. 2006; Chaty et al. 2008). Investigating the nature of these sources can provide important insight into the evolution of massive stars, the physics of compact objects, and the mechanisms driving the accretion process.
IGR J16283−4838 was discovered on April 7, 2005, by the INTEGRAL observatory (Soldi et al. 2005), and displayed a significant increase in brightness over a timescale of a few days (Paizis et al. 2005). The Swift observatory performed follow-up observations on April 13 and 15, measuring a robust position of the source (Kennea et al. 2005; Beckmann et al. 2005). Swift XRT spectra are described well by both an absorbed power law and an absorbed black body. The X-ray absorption is high (NH = 0.4−1.7 × 1023 cm-2) and variable, which suggests that it is intrinsic to the source rather than interstellar. The absorption by the Galactic interstellar medium in the source direction is almost an order of magnitude lower, hence supporting the intrinsic nature of the measured source absorption.
The precise position obtained by the XRT telescope onboard Swift allowed Rodriguez & Paizis (2005) to search for optical and NIR counterparts, to assess the nature of the system. They found a NIR source (2MASS J16281083−4838560) only 1.7″ from the Swift position, with estimated magnitudes J > 16.8, H > 15.8, and Ks = 13.95 ± 0.06. A Magellan-Baade image in the K band (Steeghs et al. 2005) shows many point sources inside the Swift-XRT error circle, the position and magnitude (K ~ 14.1) of the brightest one being fully consistent with those of the 2MASS source. A mid-IR source found in the Spitzer Galactic Legacy Midplane Survey Extraordinaire (GLIMPSE) was tentatively associated with the INTEGRAL source by Beckmann et al. (2005). No optical or UV counterpart of IGR J16283−4838 was found in Swift-UVOT data (Beckmann et al. 2005), nor in Digitized Sky Survey (DSS) images (Rodriguez & Paizis 2005). As pointed out by Beckmann et al. (2005), if the association of the NIR and mid-IR sources with IGR J16283−4838 were correct, its spectral energy distribution would then resemble those of high-mass X-ray binaries.
These arguments show the importance of additional multiwavelength investigations of IGR J16283−4838 to help identify its optical counterpart beyond any doubt. Unveiling its properties would shed light on the nature of the new population of X-ray sources discovered by INTEGRAL. With this aim, shortly after the discovery of IGR J16283−4838 we performed optical and NIR observations of this source using the ESO New Technology Telescope (NTT). In this paper, we present our observations (Sect. 2) and results (Sect. 3), and discuss their implications for the nature of IGR J16283−4838 (Sect. 4).
2. Observations
Our observations of IGR J16283−4838, which began only 11 days after the discovery, were carried out on the nights of 2005 April 18, 19, 21, and 28 (imaging), July 22 (imaging and polarimetry), and July 28 (spectroscopy), with the ESO 3.5-m NTT at La Silla Observatory, Chile. Optical and NIR images of the field of the source were obtained with the ESO Superb-Seeing Imager 2 (SUSI2) and the Son of Isaac (SOFI) instruments respectively, as part of a target-of-opportunity program (ESO 075.D-0634, P. I. Chaty). NIR images were also taken with SOFI in polarimetric mode. Low-resolution NIR spectra of the brightest counterpart candidate proposed by Beckmann (2005) were also obtained with SOFI.
SUSI2, equipped with a mosaic of two 1024 × 2048 CCD detectors, was used with U, B, V, R, and I Bessel filters for optical imaging. SOFI, equipped with a Rockwell Hg:Cd:Te 1024 × 1024 Hawaii array, was used with the Large Field (LF) objective and J, H, and Ks filters for NIR imaging. The same configuration of SOFI with the Wollaston prism, the Ks filter, and the focal-plane polarimetric mask was used to obtain NIR polarimetric images. Spectra were taken using SOFI with the LF objective and the red and blue grisms alternatively, and their corresponding order-sorting filters. The blue and red grisms cover the region between 0.95–1.64 μm and 1.53–2.52 μm, respectively.
On April 18 and 19, we took a set of very deep images in each filter to search for possible counterpart candidates not detected by previous surveys, and to perform accurate photometry of all candidates. Owing to the variable absorption, photometric intrinsic variability was expected, hence deep NIR images were also acquired ten days (April 28) and three months (July 22) later. A set of 306 and 234 short (2 s), contiguous exposures spanning about 2 hours each were also taken on April 18 and 21, respectively, to search for short-term variability. Polarimetric images were taken to search for intrinsic polarization of the NIR light, which would be expected in the case that dust is responsible for the high absorption in the source. We also took long exposure spectra of the candidate proposed by Beckmann et al. (2005) to cover the whole available NIR spectral range. Tables 1–3 give the basic parameters used for the observations. The standard reduction procedures for optical and NIR images and NIR spectra were used to obtain the final science images. The reduction of polarimetric images was performed following the procedure described in the SOFI user manual using the Image Reduction and Analysis Facility (IRAF, Tody 1993).
Optical and NIR imaging log.
Polarimetry log.
Spectroscopy log.
3. Data analysis and results
3.1. Astrometry
By analyzing Swift X-ray telescope (XRT) observations of IGR J16283−4838, Kennea et al. (2005) obtained a preliminary position  , Dec = −48°38′55″ (5″ error radius at 90% confidence level), which was refined later by Beckmann et al. (2005) to
  ,
,  (6″ error radius at 90% CL). Evans et al. (2009) developed a method to improve Swift XRT positions, reducing both systematic and statistical uncertainties to derive error circles smaller than 2″ in radius. Using their web-based form1 to combine all the available observations of the source, we obtained an enhanced position for IGR J16283−4838,
  ,
,  (1.4″ error radius at 90% CL), which we assume to be the most accurate estimate of the source position available at present.
We performed the astrometry of our images to determine the position in our frames of the Swift error circle for IGR J16283−4838 and to search for optical/NIR counterparts. We chose the best frame in each band for this purpose, and selected from it a set of bright pointlike objects in uncrowded regions. We took the coordinates of these objects from the 2MASS (for NIR frames) and USNO B1.0 (for optical frames) catalogs (Cutri et al. 2003; Monet et al. 2003), and computed the plate solution for each frame using the IRAF ccmap task. We obtained rms uncertainties smaller than 0.05″ in each coordinate for NIR frames, and 0.1″ in each coordinate for optical frames. These uncertainties are small enough for our purposes.
In Fig. 1, we show the field of the source in the Ks band, in addition to the Swift-XRT 1.4″ error circle (solid-line circle). Since the confidence level of this error circle is 90%, there is a 10% probability that the correct counterpart lies outside it. Hence, assuming a bivariate normal distribution for the position error, we constructed the 99.9% CL error circle for the source (2.43″ radius, dashed-line circle in Fig. 1). We assume that the probability of the source being outside this circle can be neglected, hence we search for optical/NIR counterparts of IGR J16283−4838 only within the circle. As can be seen in Fig. 1, three objects lie within the 99.9% CL error circle. As pointed out by Steeghs et al. (2005), the chance of finding an unrelated field star within the Swift-XRT error circle is very high at this low Galactic latitude. To illustrate this, we ran SExtractor (Bertin & Arnouts 1996) on our full Ks frame using a detection threshold of 3σ above background, and found 11 107 sources within its 5.9′ × 5.9′ field. This implies an expected mean of 1.64 objects inside the 99.9% CL error circle, which is consistent with the three we found (C1–C3, their positions are given in Table 4). The brightest candidate (C1 = 2MASS J16281083−4838560) is located at 2″ from the nominal position of the X-ray source, and the other two candidates are closer to it, but several magnitudes fainter. None of the candidates is seen in any of the optical images, which is consistent with the strong absorption towards this region (l = 335.3°, b = +0.1°, AV = 12.3 mag; Beckmann et al. 2005). At this point, there is no preferred candidate: astrometry alone cannot help us identify the counterpart of IGR J16283−4838, until subarcsecond positioning such as that achievable with Chandra is available for this source. A log N-log S diagram of the sources in our Ks frame shows that there is a 14% probability of finding at least one unrelated NIR source brighter than C1 within the 99.9% CL error, which increases to 55% and 70% for C2 and C3, respectively. This result indicates that C1 is the strongest counterpart candidate.
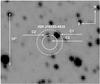 |
Fig. 1 Ks band image of the field of IGR J16283−4838. North is up and East is to the left. The solid-line circle is the Swift error circle of the source (1.4″ radius, 90% CL) computed using the method of Evans et al. (2009), while the dashed-line circle is the 99.9% CL error circle derived by us. The three counterpart candidates (C1–C3) found inside the latter are shown in the image. |
Positions of NIR counterpart candidates of IGR J16283−4838, and their distances to the nominal position of the X-ray source.
3.2. Spectroscopy
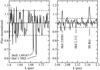 |
Fig. 2 NIR spectrum of candidate C1 in the ranges 1.6–1.75 μm (left panel) and 2.04–2.2 μm (right panel) showing the identified lines, among which we found H i and He i lines typical of early-type stars. The horizontal solid line delineates the position of the continuum, while the dashed lines indicate the 2σ uncertainties. The rest of the spectrum (see Table 3) is not shown because its faintness prevented us from extracting useful data. |
The faintness of all counterpart candidates makes it difficult to obtain their spectra, C1 being the only case in which we succeeded. Given this situation, a careful extraction of the spectrum was performed, especially in terms of sky subtraction and the removal of telluric features. In Fig. 2, we present the NIR spectra of this object taken with the red grism of SOFI (the blue grism spectrum shows a large absorption, which renders it useless). As can be seen in Fig. 2, the uncertainty in the continuum position is 3–8%, allowing us to identify only a few features in it, which are listed in Table 5.
The H i Brγ line at 2.1655 μm is clearly seen in emission. Other hydrogen lines are not detected, probably because their intensities would be below the continuum noise level. In the spectrum of C1, the He i 1.7002 μm and 2.0581 μm lines are also present, visible in absorption and emission, respectively. The 2.112/2.113 μm He i line is marginally detected at the 2σ level. Since hydrogen and helium lines are the main spectral features, some in emission, C1 may be an early-type star. We also searched for ionized helium features. According to Hanson et al. (2005), the strongest He ii line in this region of the spectrum is at 2.1885 μm, but we do not detect it. An absorption feature clearly detected near 1.6918 μm in our spectrum could be attributed to the corresponding He ii line. However, that this line should be comparable to or weaker than the 2.1885 μm one (Hanson et al. 2005) suggests that it might be an artifact due to subtraction of the sky lines. The lack of He ii lines then implies that C1 is a late O-type or early B-type star. Apart from hydrogen and helium lines, we marginally detect other absorption features, which we cannot identify.
The clear evidence of Brγ in emission is particularly interesting. Hanson et al. (2005) found this behavior only in supergiants. The stars in their sample with Brγ in emission are of luminosity class I. Among them, early-O supergiants show a strong and broad line, late-O and early-B supergiants show a weaker and narrower line, while supergiants later than B1 always show this line in absorption. As Brγ in our spectrum is relatively weak, C1 seems to be a late-O or early-B supergiant, consistent with the absence of ionized helium lines. Hence, we propose that the spectrum provides strong evidence that C1 is a late-O or early-B supergiant.
Stars such as C1 are rare objects. The catalog of Reed (2003) lists ~6000 OB supergiants in the solar neighborhood, and approximately the same number of OB dwarfs. Reed (2005) extrapolates the number of OB dwarfs in his catalog to obtain a total number of ~1.5−2.5 × 10⁵ in the Galaxy. Hence, as a rough estimate, the same values could be assumed for the number of OB supergiants in the Galaxy. Using these values and assuming OB supergiants to be uniformly distributed in the sky within the range −10° < b < 10°, the probability of finding an unrelated OB supergiant within our 99.9% CL error circle is 2−3 × 10⁻⁵. For stars such as C1, clearly a subset of OB supergiants, this probability must be even lower. This result strongly suggests that C1 is indeed the correct counterpart to IGR J16283−4838.
Lines identified in the spectrum of C1.
3.3. Photometry
Aperture photometry of all the candidates on the frames of April 28 was performed using the IRAF package apphot. This date was chosen because we have standard star observations for this night to calibrate our frames. For each frame, we measured the instrumental optical and NIR magnitudes of objects C1–C3 (or their lower limits) in the UBVRI and JHKs bands. The zero point was directly obtained from measurements of standard stars at the same airmass values. None of the counterpart candidates was detected in any of the optical bands, the upper limits to their magnitudes being U > 19.4, B > 20.6, V > 20.5, R > 20.0, and I > 17.6. However, we detect almost all of them in the NIR bands. Their NIR magnitudes are shown in Table 6. We note that our Ks magnitude of C1 is in very good agreement with that measured by Steeghs et al. (2005).
Optical and NIR magnitudes of the counterpart candidates of the high energy source IGR J16283−4838.
Figure 3 shows the observed spectral energy distribution (SED) of C1. Since the position of the GLIMPSE source SSTGLMC G335.3268+00.1016 is consistent with that of 2MASS J16281083−4838560 = C1, its photometry was included in the SED. Figure 3 shows that the fluxes of both sources are on the same order of magnitude, suggesting that a single model could fit both observations.
At mid-IR wavelengths, the SED shows a decreasing tail resembling that of a high temperature black body, while in the NIR it has a sharp cut, most probably due to absorption. Given that in the mid-IR the extinction is negligible, a distance for the source can be derived, assuming a luminosity and spectrum for the source. On the other hand, the sharp cut in the NIR can help us determine the value of the total visual extinction. We performed an absorbed black-body fit to the observed SED to constrain these properties. Following our spectral analysis, we assumed that the emission comes from a blue supergiant of absolute visual magnitude MV = −6.3 (Martins et al. 2005) at an unknown distance d, which emits like a 30 000 K black body. The radiation is absorbed by a medium of unknown visual extinction AV, which is assumed to follow the extinction law proposed by Cardelli et al. (1989). Best-fit values obtained are d = 17.2 kpc and AV = 28.9 mag. Martins et al. (2005) find a dispersion of ~0.5 mag in the absolute magnitudes of blue supergiants, which translates into a distance range of 13.6–21.6 kpc for the source. The value of AV shows no change with the assumed value of MV. The distance and visual extinction are almost insensitive to a change in the assumed temperature for the star. Varying the latter in the range 25 000–35 000 K produces a change of <0.8 kpc in distance and <0.1 mag in AV. The extinction can be transformed into a hydrogen column density of 0.52 × 1023 cm-2, in excellent agreement with the value found by Beckmann et al. (2005) for the source in quiescence. That the SED of C1 and the GLIMPSE source can be fitted by a single absorbed black-body model, of a temperature and luminosity consistent with our spectra of C1, which has an absorption in full agreement with that measured by Beckmann et al. 2005 for IGR J16283−4838, strongly supports the suggestion that the three types of emission come from the same object. Our results indicate that this object is a highly absorbed high-mass X-ray binary with a blue supergiant secondary, located beyond the Galactic center but still inside the Galaxy.
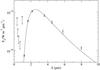 |
Fig. 3 Spectral energy distribution Fλ(λ) of C1. Squares represent the fluxes observed by us and circles those from GLIMPSE data. The solid line shows the best-fit of an absorbed black body emitting at the effective temperature of a late O or early B star (T = 30 000 K), with an absolute magnitude MV = −6.3. |
3.4. Variability
To search for the short-term variability of C1, we used the 540 Ks-band short exposures (see Table 1) to construct two light curves, one spanning ~7 ks on April 18, and the other ~5 ks on April 21. The images were averaged in groups of 6 to increase the accuracy of the photometry. To avoid the effect of the variable airmass and sky transparency in the NIR, we performed differential aperture photometry of C1 against three comparison stars in its field. The instrumental magnitude difference between the comparison stars was found to be constant within the photometric errors, hence to the accuracy of our photometry (~0.02 mag) these stars can be considered non-variable. Their magnitudes were calibrated against a standard star observed at the same airmass as one of the frames. In Fig. 4, we present the light curves obtained. Both curves exhibit random variations that are fully consistent with photometric uncertainties. A Lomb-Scargle periodogram does not display any periodicity, indicating that the data are consistent with a constant source.
We also searched for long-term variability, using the observations on April 18, 21, and 28 and July 22 to monitor possible magnitude changes on scales of days or months. Figure 5 shows that these changes do occur in C1, which was brighter in the NIR in mid April, fading later by ~0.2 mag in both H and Ks. The J band data present the opposite behavior, displaying a marginal brightening in this band. None of the other two counterpart candidates (C2–C3) shows magnitude variations between April and July 2005. The long-term variability of C1 in the NIR bands is interesting, and in addition to the properties discussed in former sections of the present work, makes a strong case for C1 = 2MASS J16281083−4838560, SSTGLMC G335.3268+00.1016, and IGR J16283−4838 being different emissions of the same astrophysical system.
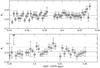 |
Fig. 4 Short-term NIR light curve of C1. Abscissas are given as modified Julian dates (MJD) since April 19, 2005, 0h UT. The dashed lines represent the mean magnitude of the source, while the dotted lines show the standard deviation in the data about the mean. C1 shows irregular variations statistically consistent with the photometric errors. |
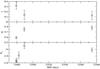 |
Fig. 5 Long-term NIR light curve of C1. Abscissas are given as modified Julian dates (MJD). C1 shows a steady decline in brightness in the H and Ks bands during late-April, but the opposite behavior in the J band. The July data imply that the source reached a steady state. |
3.5. Polarimetry
NIR polarimetry in the Ks band was performed using the observations taken with the Wollaston prism at different position angles. Images were reduced using the procedure described in the SOFI user manual. Aperture photometry was performed for candidate C1 and several stars in the field to determine their fluxes. Standard unpolarized (HD 125184) and polarized stars (HD 150193, P = 1.68 ± 0.02% at a position angle of 60 ± 1°) were also observed to ensure that instrumental and sky polarization were appropriately removed. The measurement of field stars allowed us to estimate the foreground interstellar polarization, obtaining a value of Pf = 3.7 ± 0.5% at a position angle (north through east) of 33 ± 1°. A deviation of C1 polarization from this value would indicate an intrinsic polarization of the source. For C1, we obtained P = 4.6 ± 1.0% at a position angle of 35 ± 1°, statistically consistent with the foreground value. The intrinsic polarization of the light of C1, if any, must be lower than 1%. Hence, our data suggest that the source is not polarized, which is consistent with stellar light emitted isotropically from a supergiant star.
4. Discussion
Using optical and NIR images, spectra and polarimetry, we have searched for the counterpart of the high-energy source IGR J16283−4838. We have found three candidates inside the Swift error circle of the source, which is consistent with the expected number of chance superpositions. However, several pieces of evidence suggest that the brightest one (2MASS J16281083−4838560) is the correct counterpart to the high energy source. This source, coincident with a MIR GLIMPSE source (SSTGLMC G335.3268+00.1016) exhibits NIR spectral features that are typical of late-O or early-B supergiant stars. Moreover, the combined NIR–MIR SED of the 2MASS and GLIMPSE sources is most closely fitted by an absorbed black body of luminosity and temperature consistent with these stellar types, and with an absorption in full agreement with that measured in X-rays for IGR J16283−4838. The 2MASS source also displayed a steady luminosity decrease during April 18–28, 2005, a few days after the X-ray source flare of April 7–10 and variations in its absorption during April 14–15. Hence, we infer that our results imply that 2MASS J16281083−4838560, SSTGLMC G335.3268+00.1016, and IGR J16283−4838 are the same source.
Given the association discussed above, our data strongly imply that IGR J16283−4838 is a Galactic high-mass X-ray binary, as suspected by Beckmann et al. (2005). Our classification of the donor in this system as a late-O or early-B blue supergiant, in addition to our photometry displaying a SED consistent with a high-mass stellar source in the Galaxy, with an extinction close to that derived from X-ray observations, makes the classification of IGR J16283−4838 highly secure. Our data cannot help us determine the nature of the accretor, however, as discussed by Beckmann et al. (2005), this source being similar to those in the class of highly-absorbed HMXBs discovered by INTEGRAL, such as IGR J16318−4848 (Filliatre & Chaty 2004, see also Chaty et al. 2008) or IGR J19140+0951 (Rodriguez et al. 2005). Most systems in this class have been shown to contain neutron stars as accretors. We note that our distance estimate changes the value of the source luminosity considerably, with respect to that estimated by Beckmann et al. (2005). For our 13.6–21.6 kpc range, the luminosity during the flare would have been in the range L = 1036.8−37.2 erg s-1, while in quiescence it would have been L = 1035.5−35.9 erg s-1. These values are far higher than those derived by Beckmann et al. (2005), but still consistent with a neutron star accretor. However, the possibility of a black hole accretor cannot be ruled out by the available data.
The origin of the absorption in this system is another interesting point. The variability in the X-ray absorption implies that this is caused by a circumstellar medium. A strong, variable stellar wind from the early-type donor would be a natural explanation, as pointed out by Beckmann et al. (2005). Our results suggest that the NIR and X-ray absorption are related, since the absorption obtained from our fit to the NIR–MIR SED (AV = 28.9 mag on April 28, 2005) translates into a hydrogen column density of 0.52 × 1023 cm-2, similar to that obtained by Beckmann et al. (2005) by fitting the X-ray spectra of the source on April 13 and April 15, 2005 (of 0.6 and 0.4 × 1023 cm-2, respectively). This would point to an extended medium in which both the primary and the donor would be embedded. Both the X-ray absorption and NIR luminosity interestingly exhibit variations on timescales of days. The latter could be attributed within this picture to absorption variations, although no simultaneous X-ray and NIR data are available to test this suggestion by searching for correlations between both absorption values.
If this picture is correct, the contrasting behavior of the J-band luminosity on the one hand, and H–Ks luminosity on the other remains intriguing. Emission at longer wavelengths (MIR–FIR), correlated with NIR/X-ray absorption, that has a tail reaching the NIR, would be a possible explanation of this behavior. In this case, the J-band variations may be controlled by the absorption of the system, while those in H and Ks bands could be more strongly dependent on the emission. Warm circumstellar dust in the absorber medium that reprocesses the absorbed light may produce the proposed MIR–FIR radiation. Unfortunately our data are insufficient to perform a quantitative test of this hypothesis. Follow-up observations of the flare and post-flare behavior of the source in the NIR and MIR ranges, achievable for example with instruments such as SOFI at NTT and VISIR at VLT (e.g., Rahoui et al. 2008) would be interesting to address this point. Undoubtedly, additional observations of this source are needed to reveal the particular mechanism responsible for the accretion in this class of high-mass X-ray binaries.
Available at http://www.swift.ac.uk/user_objects/
Acknowledgments
We acknowledge the comments and suggestions by the anonymous referee, which greatly enhanced our manuscript. This publication makes use of data products from the Two Micron All Sky Survey, which is a joint project of the University of Massachusetts and the Infrared Processing and Analysis Center/California Institute of Technology, funded by the National Aeronautics and Space Administration and the National Science Foundation. This research has made use of the SIMBAD database and VizieR Service operated at CDS, Strasbourg, France, and of NASA’s Astrophysics Data
System Bibliographic Services. This work was supported by the Centre National d’Etudes Spatiales (CNES). It is based on observations obtained through MINE: the Multi-wavelength INTEGRAL Network. L.J.P. acknowledges support by grant PICT 2007-00848 of Argentine ANPCyT.
References
- Beckmann, V., Kennea, J. A., Markwardt, C., et al. 2005, ApJ, 631, 506 [NASA ADS] [CrossRef] [Google Scholar]
- Bertin, E., & Arnouts, S. 1996, A&AS, 117, 393 [NASA ADS] [CrossRef] [EDP Sciences] [Google Scholar]
- Cardelli, J. A,Clayton, G. C., & Mathis, J. S. 1989, ApJ, 345, 245 [NASA ADS] [CrossRef] [Google Scholar]
- Chaty, S., Rahoui, F., Foellmi, C., et al. 2008, A&A, 484, 783 [NASA ADS] [CrossRef] [EDP Sciences] [Google Scholar]
- Cutri, R. M., Skrutskie, M. F., van Dyk, S., et al. 2003, 2MASS All-Sky Catalog of Point Sources, University of Massachusetts and Infrared Processing and Analysis Center, (IPAC/California Institute of Technology), Vizier online catalog II/246 [Google Scholar]
- Evans, P. A., Beardmore, A. P., Page, K. L., et al. 2009, MNRAS, 397, 1177 [NASA ADS] [CrossRef] [Google Scholar]
- Filliatre, P., & Chaty, S. 2004, ApJ, 616, 469 [NASA ADS] [CrossRef] [Google Scholar]
- Hanson, M. M., Kudritzki, R.-P., Kenworthy, M. A., et al. 2005, ApJS, 161, 154 [NASA ADS] [CrossRef] [EDP Sciences] [MathSciNet] [Google Scholar]
- Kennea, J. A., Burrows, D. N., Nousek, J. A., et al. 2005, ATel, 459 [Google Scholar]
- Kuulkers, E. 2005, AIP Conf. Proc. 797, 402 [Google Scholar]
- Martins, F., Schaerer, D., & Hillier, D. J. 2005, A&A, 436, 1049 [NASA ADS] [CrossRef] [EDP Sciences] [Google Scholar]
- Masetti, N., Pretorius, M. L., Palazzi, E., et al. 2006, A&A, 449, 1139 [NASA ADS] [CrossRef] [EDP Sciences] [Google Scholar]
- Monet, D. G., Levine, S. E., Canzian, B., et al. 2003, AJ, 125, 984 [NASA ADS] [CrossRef] [Google Scholar]
- Negueruela, I. 2004, in The Many Scales of the Universe – JENAM 2004 Astrophysics Reviews, ed. J. C. del Toro Iniesta, et al., Proc of the Joint European and Spanish Astronomical Meeting, Granada, Spain, September 2004 [arXiv:astro-ph/0411759] [Google Scholar]
- Negueruela, I., Smith, D. M., & Chaty, S. 2005, ATel, 429 [Google Scholar]
- Negueruela, I., Smith, D. M., Harrison, Th. E., & Torrejón, J. M. 2006, ApJ, 638, 982 [NASA ADS] [CrossRef] [Google Scholar]
- Paizis, A., Miller, J. M., Soldi, S., & Mowlavi, N. 2005, ATel, 458 [Google Scholar]
- Pellizza, L. J., Chaty, S., & Negueruela, I. 2006, A&A, 455, 653 [NASA ADS] [CrossRef] [EDP Sciences] [Google Scholar]
- Rahoui, F., Chaty, S., Lagage, P.-O., & Pantin, E. 2008, A&A, 484, 801 [NASA ADS] [CrossRef] [EDP Sciences] [Google Scholar]
- Reed, B. C. 2003, AJ, 125, 2531 [NASA ADS] [CrossRef] [Google Scholar]
- Reed, B. C. 2005, AJ, 130, 1652 [NASA ADS] [CrossRef] [Google Scholar]
- Rodriguez, J., & Paizis, A. 2005, ATel, 460 [Google Scholar]
- Rodriguez, J., Cabanac, C., Hannikainen, D. C., et al 2005, A&A, 432, 235 [NASA ADS] [CrossRef] [EDP Sciences] [Google Scholar]
- Smith, D. M. et al. 2006, ApJ, 638, 974 [NASA ADS] [CrossRef] [Google Scholar]
- Soldi, S., Brandt, S., Domingo Garau, A., et al. 2005, ATel, 456 [Google Scholar]
- Steeghs, D., Torres, M. A. P., Jonker, P. G., et al. 2005, ATel, 478 [Google Scholar]
- Tody, D. 1993, in Astronomical Data Analysis Software and Systems II, eds. R. J. Hanisch, R. J. V. Brissenden, & J. Barnes, ASP Conf. Ser., 52, 173 [Google Scholar]
All Tables
Positions of NIR counterpart candidates of IGR J16283−4838, and their distances to the nominal position of the X-ray source.
Optical and NIR magnitudes of the counterpart candidates of the high energy source IGR J16283−4838.
All Figures
|
Fig. 1 Ks band image of the field of IGR J16283−4838. North is up and East is to the left. The solid-line circle is the Swift error circle of the source (1.4″ radius, 90% CL) computed using the method of Evans et al. (2009), while the dashed-line circle is the 99.9% CL error circle derived by us. The three counterpart candidates (C1–C3) found inside the latter are shown in the image. |
| In the text | |
|
Fig. 2 NIR spectrum of candidate C1 in the ranges 1.6–1.75 μm (left panel) and 2.04–2.2 μm (right panel) showing the identified lines, among which we found H i and He i lines typical of early-type stars. The horizontal solid line delineates the position of the continuum, while the dashed lines indicate the 2σ uncertainties. The rest of the spectrum (see Table 3) is not shown because its faintness prevented us from extracting useful data. |
| In the text | |
|
Fig. 3 Spectral energy distribution Fλ(λ) of C1. Squares represent the fluxes observed by us and circles those from GLIMPSE data. The solid line shows the best-fit of an absorbed black body emitting at the effective temperature of a late O or early B star (T = 30 000 K), with an absolute magnitude MV = −6.3. |
| In the text | |
|
Fig. 4 Short-term NIR light curve of C1. Abscissas are given as modified Julian dates (MJD) since April 19, 2005, 0h UT. The dashed lines represent the mean magnitude of the source, while the dotted lines show the standard deviation in the data about the mean. C1 shows irregular variations statistically consistent with the photometric errors. |
| In the text | |
|
Fig. 5 Long-term NIR light curve of C1. Abscissas are given as modified Julian dates (MJD). C1 shows a steady decline in brightness in the H and Ks bands during late-April, but the opposite behavior in the J band. The July data imply that the source reached a steady state. |
| In the text | |
Current usage metrics show cumulative count of Article Views (full-text article views including HTML views, PDF and ePub downloads, according to the available data) and Abstracts Views on Vision4Press platform.
Data correspond to usage on the plateform after 2015. The current usage metrics is available 48-96 hours after online publication and is updated daily on week days.
Initial download of the metrics may take a while.