Fig. 1
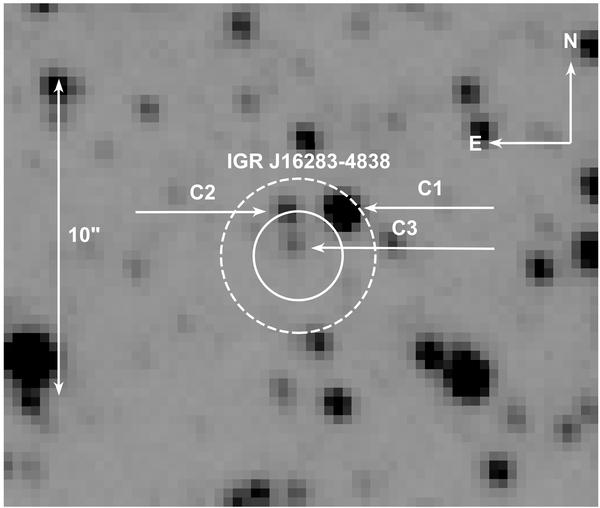
Ks band image of the field of IGR J16283−4838. North is up and East is to the left. The solid-line circle is the Swift error circle of the source (1.4″ radius, 90% CL) computed using the method of Evans et al. (2009), while the dashed-line circle is the 99.9% CL error circle derived by us. The three counterpart candidates (C1–C3) found inside the latter are shown in the image.
Current usage metrics show cumulative count of Article Views (full-text article views including HTML views, PDF and ePub downloads, according to the available data) and Abstracts Views on Vision4Press platform.
Data correspond to usage on the plateform after 2015. The current usage metrics is available 48-96 hours after online publication and is updated daily on week days.
Initial download of the metrics may take a while.