Fig. 8
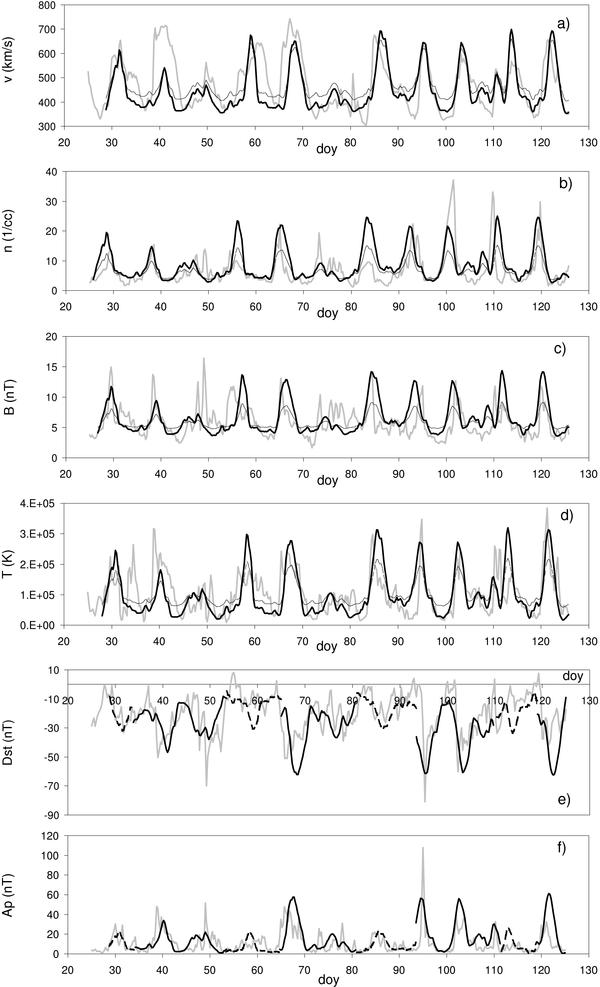
a)–d) Comparison of the observed solar wind parameters with the calculated values. The observed data are inicated by the thick gray line, calculated values (using linear regression parameters a and b as given in Table 2) are drawn by thin black line, and the amplitude-optimized “predicted” values (using linear regression parameters acorr and bcorr as given in Table 2) are drawn by thick black line. e) − f) Comparison of the measured values of the geomagnetic indices Dst and Ap with the calculated values. The observed data are delineate by the thick gray line, values calculated for the N-polarity CHs are drawn by thick-dashed line, and S-polarity CHs are indicated by thick-black line. See text for details.
Current usage metrics show cumulative count of Article Views (full-text article views including HTML views, PDF and ePub downloads, according to the available data) and Abstracts Views on Vision4Press platform.
Data correspond to usage on the plateform after 2015. The current usage metrics is available 48-96 hours after online publication and is updated daily on week days.
Initial download of the metrics may take a while.