Fig. 2
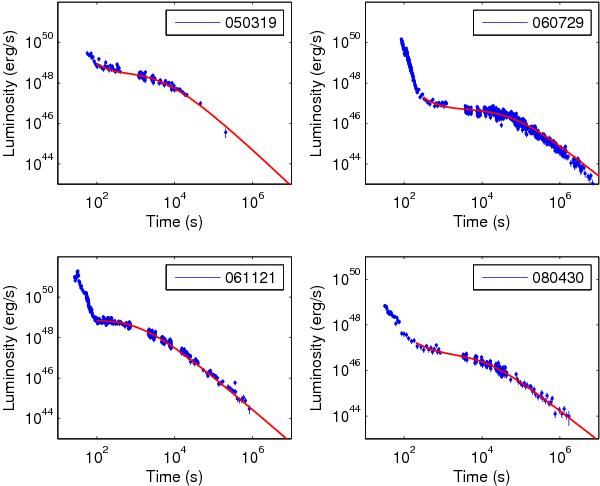
Least-square fit to the X-ray lightcurves of four selected GRB afterglows observed by Swift/XRT obtained through our Eqs. (8) and (9). The blue points and red lines represent the measured (isotropic) luminosity (in the 0.3–100 keV energy range) and best fits, respectively. The starting time T0 was determined for each afterglow based on the end of the spectral transition from the previous steep-decay phase, as discussed in the text. Best-fit parameter values for each individual lightcurve are reported in Table 1.
Current usage metrics show cumulative count of Article Views (full-text article views including HTML views, PDF and ePub downloads, according to the available data) and Abstracts Views on Vision4Press platform.
Data correspond to usage on the plateform after 2015. The current usage metrics is available 48-96 hours after online publication and is updated daily on week days.
Initial download of the metrics may take a while.