Fig. 7
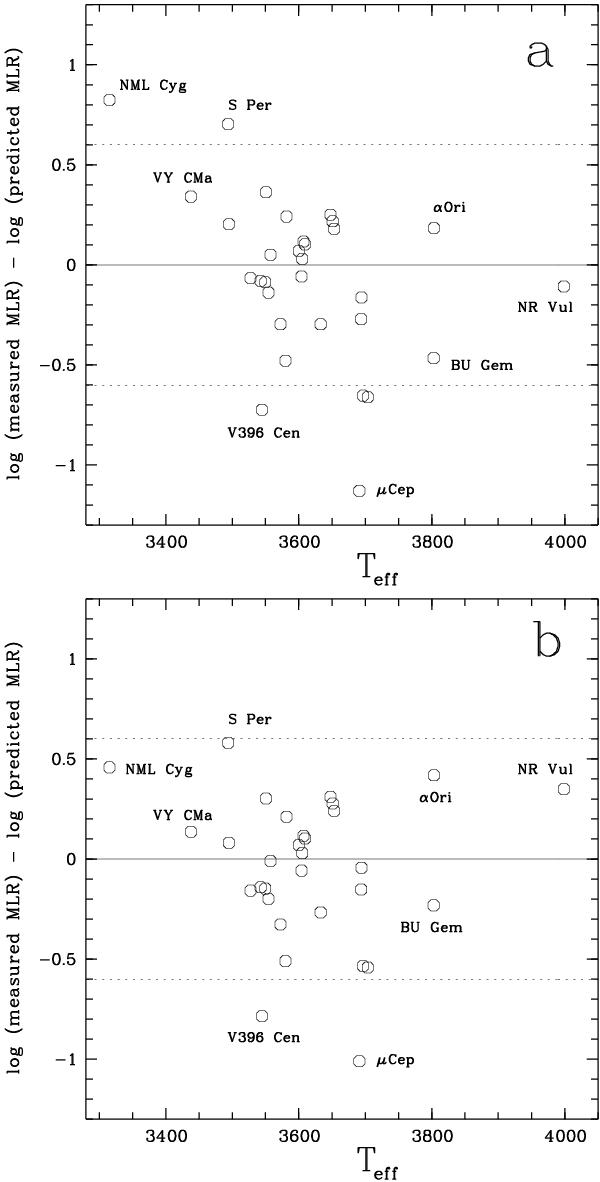
Panel a): discrepancies between measured mass-loss rates (MLR) and mass-loss rates predicted by the de Jager prescription, plotted versus Teff, for Galactic red supergiants. The horizontal dotted lines indicate discrepancies by factors 4 and 1/4. Panel b): same as panel a) when the de Jager rate is multiplied by (Teff/3600)-10.
Current usage metrics show cumulative count of Article Views (full-text article views including HTML views, PDF and ePub downloads, according to the available data) and Abstracts Views on Vision4Press platform.
Data correspond to usage on the plateform after 2015. The current usage metrics is available 48-96 hours after online publication and is updated daily on week days.
Initial download of the metrics may take a while.