Free Access
Fig. 6
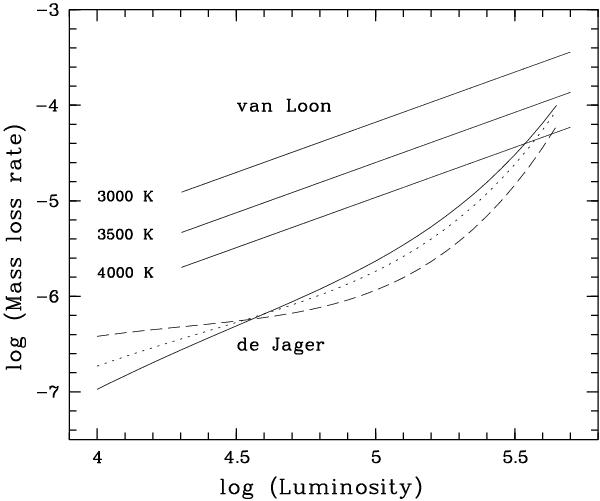
Mass-loss rate prescription of van Loon et al. (2005) and de Jager (1988) with Ṁ plotted as a function of luminosity and for three values of Teff. The de Jager lines are solid, dotted and dashed for 4000, 3500 and 3000 K respectively.
Current usage metrics show cumulative count of Article Views (full-text article views including HTML views, PDF and ePub downloads, according to the available data) and Abstracts Views on Vision4Press platform.
Data correspond to usage on the plateform after 2015. The current usage metrics is available 48-96 hours after online publication and is updated daily on week days.
Initial download of the metrics may take a while.