| Issue |
A&A
Volume 525, January 2011
|
|
|---|---|---|
| Article Number | A146 | |
| Number of page(s) | 4 | |
| Section | Stellar structure and evolution | |
| DOI | https://doi.org/10.1051/0004-6361/201015684 | |
| Published online | 09 December 2010 | |
Research Note
A detection of an anti-correlated hard X-ray lag in AM Herculis
1
International Center for Astrophysics, Korea Astronomy and Space Science
Institute,
Daejeon
305-348,
Republic of Korea
e-mail: astrosriram@yahoo.co.in
2
Tata Institute of Fundamental Research,
Mumbai
400005,
India
Received:
3
September
2010
Accepted:
26
October
2010
Context. Earlier cross-correlation studies for AM Her were performed in various energy ranges from optical to X-ray, and it was suggested that it mostly shows a high level of correlation, but on occasion it shows a low level of correlation or even no correlation at all.
Aims. We aim to investigate the degree of correlation between soft (2−4 keV) and hard (9−20 keV) X-rays, and perform a cross-correlation study of the X-ray data sets of AM Her obtained with RXTE.
Methods. We cross-correlate the background-subtracted soft and hard X-ray light curves with the XRONOS program crosscor and fit a model to the obtained cross-correlation functions.
Results. We detect a hard X-ray lag of 192 ± 33 s in a specific section of energy-dependent light curve, where the soft X-ray (2−4 keV) intensity decreases but the hard X-ray (9−20 keV) intensity increases. From a spectral analysis, we find that the X-ray emission temperature increases during the anti-correlated intensity variation. In two other observations, the cross-correlation functions show a low level of correlation, which is consistent with the earlier results performed in a different energy range.
Conclusions. We report a detection of an anti-correlated hard X-ray lag of ~190 s from the proto-type polar AM Her. The hard X-ray lag is detected for the first time in the given energy range, and it is the longest lag among those reported in magnetic cataclysmic variables. We discuss the implications of our findings with regard to the origin of the hard X-ray lag and the anti-correlated intensity variation.
Key words: binaries: general / stars: individual: AM Herculis / stars: magnetic field / X-rays: stars
© ESO, 2010
1. Introduction
Magnetic cataclysmic variables (mCVs) are binaries consisting of a magnetized white dwarf and a late spectral type companion. The magnetic field strength is one of the important parameters when they are categorized into subclasses. In polars (AM Her-type, B ~ 10−230 MG) and intermediate polars (DQ Her-type, B ~ 1−10 MG), the accretion stream or flow from the companion follows field lines that are connected to the magnetic poles of the white dwarf (WD). As the magnetically channeled material accretes onto the magnetic poles (known as an accretion column), it experiences a strong standing shock above the magnetic poles of the WD surface, and subsequently reaches a high temperature (~108 K). The hot plasma in the post-shock region cools by emitting thermal bremsstrahlung X-ray radiation and cyclotron radiation, which is observed outside the typical X-ray range. Some of the hard X-rays are intercepted by the surface of the WD and are re-radiated as soft X-ray and EUV regions (e.g. Lamb & Masters 1979). Therefore, the WD surface and the post-shock regions are mainly responsible for the soft (E ≤ 1 keV) and hard (E ≥ 1 keV) X-ray emissions of polars and intermediate polars, respectively.
Many theoretical models were developed to explain the accretion column (Aizu 1973; King & Lasota 1979; Imamura & Durisen 1983; Cropper 1990; Wu 1994; Woelk & Beuermann 1996; Cropper et al. 1998, 1999). A blobby accretion model was proposed to interpret the phenomena of flickerings, low-level correlations, and the soft excesses often observed in the light curves and spectra of mCVs (Kuijpers & Pringle 1982; Frank et al. 1988; Hamuery & King 1988). A comprehensive review of the radiative process for mCVs was given by Wu (2000).
Observational information pertaining to an inhomogeneous accretion stream or an accretion column that contains dense blobs can be found from studying X-ray light curves, particularly a cross-correlation analysis of energy-dependent light curves. This study was performed for the first time for AM Her in the optical (V band) and soft X-ray regions (Szkody et al. 1980; Tuohy et al. 1981). Later, an analysis of the Einstein observatory data of AM Her and EF Eri detected no significant X-ray lag at short time scales, but found a low level of correlation (Stella et al. 1986; Beuermann et al. 1987; Watson et al. 1987). Ramsay & Cropper (2002) reported an anti-correlated hard X-ray lag (20−40 s) for the asynchronous polar BY Cam between soft (0.1−0.3 keV) and hard (1−10 keV) X-ray light curves of the XMM-Newton data. They took this delay to be caused by the obscuration of hard X-rays by optically thick material produced as a result of collisions between dense blobs and the surface of the WD.
In this paper, we report the results of cross-correlation analysis of RXTE observations of a proto-type polar AM Her, which show anti-correlated intensity variations and an X-ray lag.
2. Data reduction and analysis
The RXTE satellite has three on-board detectors, the Proportional Counter Array (PCA, Jahoda et al. 2006), the High-Energy X-ray Timing Experiment (HEXTE, Rothschild et al. 1995), and the All-Sky Monitor (ASM, Levine et al. 1996). There are 27 observation data sets for AM Her in the RXTE archives, referred to as ObsIds. We acquired all PCA data from the HEASARC public archives and used the standard 2 format data to obtain background-subtracted light curves in different energy bands. Using the HEASOFT software v6.8, we filtered the data by applying all the required procedures presented by Christian (2000).
2.1. Temporal analysis
The three RXTE observations of AM Her used for our cross-correlation study.
The soft (2−4 keV) and hard X-ray (9−20 keV) light curves of the three data sets along with the hardness ratio (with a bin size of 32 s) are plotted in Fig. 1 in the top-left panel (ObsId 30007-01-01-00), in Fig. 1 in the bottom-left panel (ObsId 20010-01-01-030), and in Fig. 2 in the top panel (ObsId 20010-01-01-00). To study the X-ray lags, we cross-correlated the soft and hard X-ray light curves with the XRONOS program crosscor (for details see, e.g., Sriram et al. 2007; Lei et al. 2008). This program calculates the error bars by the usual method for direct cross-correlation (crosscorr with fast=no option1), i.e., theoretical error bars for a normal distribution of errors in the data and error propagation methods are used for larger numbers of intervals. In most sections, the CCFs showed a positive peak at a lag of zero. For example, the first section of the light curve for ObsId 30007-01-01-00 displays a strong correlation between the soft and hard X-ray light curves, and the CCF in the top-right panel of Fig. 1 represents a peak at zero lag. Although most sections displayed such strong correlations at zero lag, we found a weak anti-correlated intensity variation in two sections, the first in ObsId 30007-01-01-00 and the second in 20010-01-01-030 (marked by vertical lines). In ObsId 30007-01-01-00, the second CCF shows an anti-correlation with a lag, but the CCF is noisy and not very significant, whereas the CCF of 20010-01-01-030 shows a low level of correlation (see the bottom-right panels in Fig. 1).
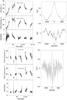 |
Fig. 1 Top: the PCA soft (2−4 keV) and hard (9−20 keV) X-ray light curves of AM Her, along with the hardness ratios (ratios of 9−20 keV counts to 2−4 keV counts), are shown for ObsId 30007-01-01-00. The vertical lines in the light curves represent the sections used in our cross-correlation study. The cross-correlation functions (CCF) for the first and second sections are displayed in the two top-right panels, respectively. Bottom: similar to the top panel but for ObsId 20010-01-01-030. |
However, in one section of ObsId 20010-01-01-00 (marked by vertical lines in Fig. 2), we found an anti-correlated intensity variation between the soft and hard X-ray light curves (the other sections of the light curve show a strong correlated intensity variation). We performed the cross-correlation analysis with 32 s bin data for all sections of ObsId 20010-01-01-00 and found that the CCFs show a positive peak at zero lag similar to the top-right panel of Fig. 1, except for the selected section marked by vertical lines. The marked section was selected on the basis of an opposite intensity variation. That is, in this section, the soft X-ray intensity varies from 24 c/s to 21 c/s whereas the corresponding hard X-ray varies from 22 c/s to 44 c/s.
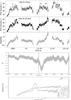 |
Fig. 2 Top: the PCA soft (2−4 keV) and hard (9−20 keV) X-ray light curves of AM Her, along with the hardness ratios, are shown for ObsId 20010-01-01-00. The solid vertical lines represent the section used in our cross-correlation study. We extracted the energy spectra from the subsections A and B (see text). Middle: the cross-correlation function (CCF) for the selected section is presented. The dashed line represents the mean of the CCF and the gray shaded region corresponds to the error range obtained from the crosscor (see text). The vertical line represents a lag of zero. Bottom: the unfolded spectra (for the Sects. A and B, see top panel) are shown together with the fitted model functions. |
The CCF for the selected section is shown in the middle panel of Fig. 2, which indicates an anti-correlation with a lag. We also performed the cross-correlation analysis for this section with higher time bin (64 s and 96 s) data and found that the lag is still present. To calculate the X-ray lag time, we fitted an inverted Gaussian function using the chi-square minimization method to the CCF of a correlation coefficient (cc) of −0.42 ± 0.09. For this fit, we took a negative value for the normalization (−0.42) of the Gaussian function and fitted the CCF profile spanning −500 s to 500 s (d.o.f. = 30). We found that the hard X-rays are delayed compared to the soft X-rays at a time of 192 ± 33 s (where the measured lag time, i.e. the Gaussian fit offset from zero lag time, is significant at a confidence level of 5.8σ and the CCF amplitude is about 4σ. The error is estimated using the criterion Δχ2 = 2.71).
For the section of interest, we also extracted light curves in five different energy bands, viz. 4−5 keV, 5−6.5 keV, 6.5−9.0 keV, 9−12 keV and 12−30 keV. These light curves were cross-correlated with the 2−4 keV light curve. It was subsequently found that apart from the 4−5 keV band, all other CCFs showed a similar lag at ~200 s. To study further, we divided this section into two segments (each segment has of ~1500 s) and performed the analysis. The CCFs showed an anti-correlation (the first segment cc = −0.51 ± 0.1 and the second segment cc = −0.41 ± 0.09) with a lag of ~200 ± 30 s. Hence, we concluded that there is no energy dependency for the observed lag time and the lag is persistent in this section.
2.2. Spectral analysis
To investigate whether there is a significant spectral change during the anti-correlated intensity variation, we divided the section of interest into two subsections and extracted energy spectra (2.5−30.0 keV) from subsections A and B (top panel of Fig. 2). It was found that the spectra prominently change below and above the energy of ~4 keV (the bottom panel of Fig. 2). A similar kind of study was performed on the other sections (i.e. we divided each section into two subsections and checked their spectra by overplotting the spectra of two subsections) and found that the other sections do not show such a significant spectral change between the subsections. There was a change mainly in normalization between the spectra of the given subsections. This study strongly supports that the observed spectral change for the selected section is related with the anti-correlated intensity variation. A similar spectral change was also observed in neutron star and black hole sources for which anti-correlated X-ray lags were observed (Choudhury et al. 2005; Lei et al. 2008; Sriram et al. 2007, 2009). This clearly indicates that an astrophysical change of the emission/absorption region is required to explain the spectral and the anti-correlated intensity variations, as well as the observed hard X-ray delay.
To pin down which parameter is responsible for the spectral variation, we fitted a model to the spectra using the XSPEC software v12.5 (Arnaud 1996). The model consists of a thermal bremsstrahlung emission and a Gaussian function for the emission feature around 6.4 keV. The model also includes an absorption component parameterized with the hydrogen equivalent column density (NH) along the line of sight. The bottom panel of Fig. 2 shows unfolded spectra together with the fitted model functions. The best-fit spectral parameters are tabulated in Table 2. It was found that during the anti-correlated variation, the emission temperature increased significantly from kTTB ~ 13 keV to kTTB ~ 20 keV, indicating that the spectrum evolved toward a relatively harder state. It was also found that the absorption column density increased during the variation.
3. Discussion and summary
Despite the many attempts to do so in the optical to X-ray energy range, a statistically significant lag phenomenon has not been found in the polar AM Her (Szkody et al. 1980; Tuohy et al. 1981; Stella et al. 1986; Watson et al. 1987). The cross-correlation study between Ginga hard X-ray and optical data showed that the correlation between them decreases toward bluer wavelengths (Beardmore & Osborne 1997). Christian (2000) observed AM Her simultaneously in EUV and X-ray energy bands and the cross-correlation study showed no significant correlation. Stella et al. (1986) found uncorrelated soft and hard X-ray short-term variations from AM Her. Beuermann et al. (1987) and Watson et al. (1987) observed a low level of correlation from EF Eri. A significant hard X-ray lag with a time scale of 20−40 s has thus far only been reported for the asynchronous polar BY Cam (Ramsay & Cropper 2002).
In this study, we observed three anti-correlated intensity variations in total from specific sections of the light curves of AM Her. For example, in the section of ObsId 30007-01-01-00, the hard (9−20 keV) X-ray intensity decreases, but the soft (2−4 keV) X-ray intensity increases (Fig. 1). On the other hand, in the two sections of ObsId 20010-01-01-030 and ObsId 20010-01-01-00, the hard X-ray intensity increases, whereas the soft X-ray intensity decreases (Figs. 1 and 2). This kind of anti-correlated intensity variation can be seen in Christian (2000; see Fig. 2 in the paper particularly the X-ray and EUV light curves at phases 0.2−0.3, 1.0−1.2 and 1.6−1.7) and in Beardmore & Osborne (1997; see their optical and X-ray light curves in Fig. 8). These anti-correlated intensity variations strongly suggest that our observed variations are genuine and on occasion the degree of correlation decreases. Furthermore, we detected a hard lag of ~190 s from one of the specific sections (see Sect. 2.1), which is statistically significant at a confidence level of 5.8σ. The hard lag indicates that hard X-ray photons are relatively delayed in their arrivals at the observer compared with the arrivals of soft X-ray photons. We also found that both the X-ray emission temperature and the absorption column density increase during the anti-correlated intensity variation (see Sect. 2.2).
One may raise the question whether these results may be caused a sudden intensity change. In general, a sudden intensity change in the light curve may result in a spurious X-ray lag. To test this possibility, we performed a cross-correlation analysis after removing the spike-like feature at ~1.6 × 10⁴ s (between subsection A and B in Fig. 2), finding that the CCF profile together with the corresponding hard X-ray lag (~190 s) remain. This signifies that the obtained hard X-ray lag is not caused by the spike-like feature.
The observed hard X-ray lag can be explained in principle if a dense material exists that obscures only the region that emits the hard X-ray for a short duration. Therefore, we can consider dense blobs to be possibly involved intermittently in an accretion stream or flow. This scenario, however, is unlikely because it requires a very special geometrical condition to obscure only the hard X-ray emitting region at the magnetospheric boundary of the WD, i.e., this specific configuration is difficult to attain in this system for a short duration. Furthermore, with this scenario, it is difficult to interpret the spectral change as well as the anti-correlated intensity variation obtained in Sect. 2.
The RXTE PCA energy range (2−30 keV) is sensitive to the typical bremsstrahlung continuum radiation of the post-shock region, but insensitive to the UV/soft X-ray component often observed in AM Her with a temperature of 20−40 eV. Therefore, it is reasonable to consider an accretion column containing dense blobs. We conjecture that the blobs can disturb the temperature and density structures of the post-shock region. For example, if some of the material of the blobs splashes back into the accretion column after colliding with the WD’s surface, this material may take on a configuration that produces the observed hard X-ray lag. This scenario was proposed by Ramsay & Cropper (2002) in their interpretation of the hard X-ray lag of the source BY Cam. Because the hard X-ray lag is not detected on all occasions, this indicates that the splashed material stays at the hard X-ray emitting region for a short duration. We speculate that the duration of disturbance in the accretion column would depend on the inflow time of the blobs. We also postulate that both the anti-correlated intensity variation (Fig. 2) and the spectral change (bottom panel of Fig. 2 and Table 2) can be explained if some of the splashed material can be heated up to emit hard X-ray radiation. It is, however, difficult to explain our results consistently because there is a lack of theoretical understanding regarding how the splashed back material disturbs the temperature and density structures of the accretion column.
In summary, we report a hard X-ray lag of 192 ± 33 s in a specific section of the energy-dependent light curve of AM Her, which is statistically significant at a confidence level of 5.8σ. The corresponding hard (9−20 keV) and soft (2−4 keV) X-ray intensities display a strong anti-correlated variation. We also found that both the X-ray emission temperature and the absorption column density increase during the anti-correlated intensity variation (see Sect. 2.2). The hard X-ray lag is detected for the first time in the given energy range, and it is the longest lag among those reported in polars and intermediate polars. In two other observations, the cross-correlation functions of energy-dependent light curves showed a low level of correlation, which is consistent with the earlier results obtained from a different energy range. It is proposed that a similar study of the other mCVs is important to determine the astrophysical conditions of the post-shock region.
Best-fit spectral parameters for the spectra of the A and B subsections.
Acknowledgments
We are grateful to the anonymous referee for useful comments. This research has made use of data obtained through the HEASARC Online Service, provided by NASA/GSFC in support of the NASA High Energy Astrophysics Programs.
References
- Aizu, K. 1973, Prog. Theor. Phys., 49, 184 [Google Scholar]
- Arnaud, K. A. 1996, ADASS, 5, 17 [NASA ADS] [Google Scholar]
- Beardmore, A. P., & Osborne, J. P. 1997, MNRAS, 290, 145 [NASA ADS] [Google Scholar]
- Beuermann, K., Stella, L., & Patterson, J. 1987, ApJ, 316, 360 [NASA ADS] [CrossRef] [Google Scholar]
- Christian, D. J. 2000, AJ, 119, 1930 [NASA ADS] [CrossRef] [Google Scholar]
- Choudhury, M., Rao, A. R., Dasgupta, S., et al. 2005, ApJ, 631, 1072 [NASA ADS] [CrossRef] [Google Scholar]
- Cropper, M. 1990, Space Sci. Rev., 54, 195 [NASA ADS] [CrossRef] [Google Scholar]
- Cropper, M., Ramsay, G., & Wu, K. 1998, MNRAS, 293, 222 [NASA ADS] [CrossRef] [Google Scholar]
- Cropper, M., Wu, K., Ramsay, G., & Kocabiyik, A. 1999, MNRAS, 306, 684 [NASA ADS] [CrossRef] [Google Scholar]
- Frank, J., King, A. R., & Lasota, J. P. 1988, A&A, 193, 113 [NASA ADS] [Google Scholar]
- Hameury, J. M., & King, A. R. 1988, MNRAS, 1988, 235, 433 [Google Scholar]
- Imamura, J. N., & Durisen, R. H. 1983, ApJ, 268, 291 [NASA ADS] [CrossRef] [Google Scholar]
- Jahoda, K., Markwardt, C. B., Radeva, Y., et al. 2006, ApJS, 163, 401 [NASA ADS] [CrossRef] [Google Scholar]
- King, A. R., & Lasota, J. P. 1979, MNRAS, 188, 653 [NASA ADS] [CrossRef] [Google Scholar]
- Kuijpers, J., & Pringle, J. E. 1982, A&A, 114, L4 [NASA ADS] [Google Scholar]
- Lamb, D. Q., & Master, A. R. 1979, ApJ, 234, L117 [NASA ADS] [CrossRef] [Google Scholar]
- Lei, Y. J., Qu, J. L., Song, L. M., et al. 2008, ApJ, 677, 461 [NASA ADS] [CrossRef] [Google Scholar]
- Levine, A. M., Bradt, H., Cui, W., et al. 1996, ApJ, 469, L33 [NASA ADS] [CrossRef] [Google Scholar]
- Rothschild, R. E., Matteson, J. L., Heindl, W., et al. 1995, Proc. SPIE, 2518, 13 [NASA ADS] [CrossRef] [Google Scholar]
- Ramsay, G., & Cropper, M. 2002, MNRAS, 334, 805 [NASA ADS] [CrossRef] [Google Scholar]
- Sriram, K., Agrawal, V. K., Pendharkar, J. K., & Rao, A. R. 2007, ApJ, 661, 1055 [NASA ADS] [CrossRef] [Google Scholar]
- Sriram, K., Agrawal, V. K., & Rao, A. R. 2009, RAA, 9, 901 [NASA ADS] [Google Scholar]
- Stella, L., Beuermann, K., & Patterson, J. 1986, ApJ, 306, 225 [NASA ADS] [CrossRef] [Google Scholar]
- Szkody, P., Tuohy, I. R., Cordova, F. A., et al. 1980, ApJ, 241, 1070 [NASA ADS] [CrossRef] [Google Scholar]
- Tuohy, I. R., Mason, K. O., Garmire, G. P., & Lamb, F. K. 1981, ApJ, 245, 183 [NASA ADS] [CrossRef] [Google Scholar]
- Watson, M. G., King, A. R., & Williams, G. A. 1987, MNRAS, 226, 867 [NASA ADS] [Google Scholar]
- Woelk, U., & Beuermann, K. 1996, A&A, 306, 232 [NASA ADS] [Google Scholar]
- Wu, K. 1994, Proc. Astron. Soc. Aust., 11, 61 [NASA ADS] [Google Scholar]
- Wu, K. 2000, Space Sci. Rev., 93, 611 [NASA ADS] [CrossRef] [Google Scholar]
All Tables
All Figures
|
Fig. 1 Top: the PCA soft (2−4 keV) and hard (9−20 keV) X-ray light curves of AM Her, along with the hardness ratios (ratios of 9−20 keV counts to 2−4 keV counts), are shown for ObsId 30007-01-01-00. The vertical lines in the light curves represent the sections used in our cross-correlation study. The cross-correlation functions (CCF) for the first and second sections are displayed in the two top-right panels, respectively. Bottom: similar to the top panel but for ObsId 20010-01-01-030. |
| In the text | |
|
Fig. 2 Top: the PCA soft (2−4 keV) and hard (9−20 keV) X-ray light curves of AM Her, along with the hardness ratios, are shown for ObsId 20010-01-01-00. The solid vertical lines represent the section used in our cross-correlation study. We extracted the energy spectra from the subsections A and B (see text). Middle: the cross-correlation function (CCF) for the selected section is presented. The dashed line represents the mean of the CCF and the gray shaded region corresponds to the error range obtained from the crosscor (see text). The vertical line represents a lag of zero. Bottom: the unfolded spectra (for the Sects. A and B, see top panel) are shown together with the fitted model functions. |
| In the text | |
Current usage metrics show cumulative count of Article Views (full-text article views including HTML views, PDF and ePub downloads, according to the available data) and Abstracts Views on Vision4Press platform.
Data correspond to usage on the plateform after 2015. The current usage metrics is available 48-96 hours after online publication and is updated daily on week days.
Initial download of the metrics may take a while.