Fig. 2
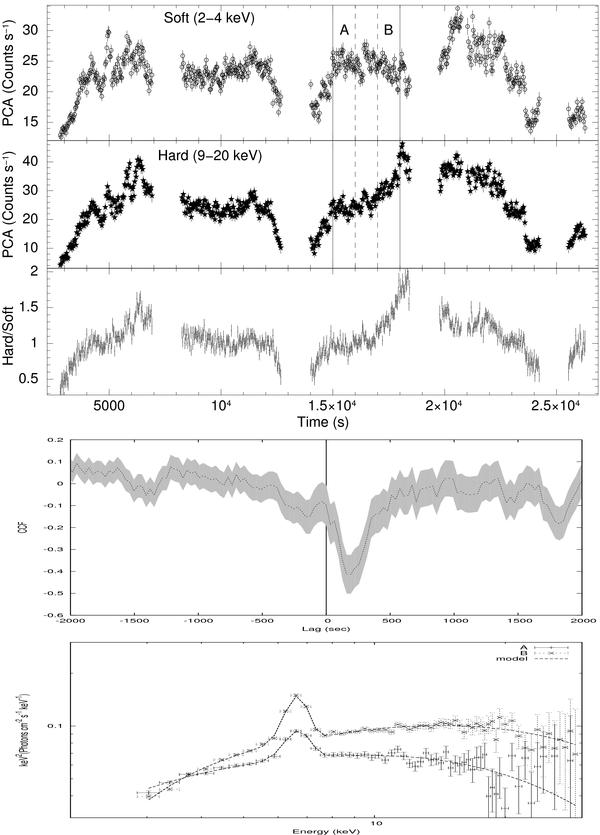
Top: the PCA soft (2−4 keV) and hard (9−20 keV) X-ray light curves of AM Her, along with the hardness ratios, are shown for ObsId 20010-01-01-00. The solid vertical lines represent the section used in our cross-correlation study. We extracted the energy spectra from the subsections A and B (see text). Middle: the cross-correlation function (CCF) for the selected section is presented. The dashed line represents the mean of the CCF and the gray shaded region corresponds to the error range obtained from the crosscor (see text). The vertical line represents a lag of zero. Bottom: the unfolded spectra (for the Sects. A and B, see top panel) are shown together with the fitted model functions.
Current usage metrics show cumulative count of Article Views (full-text article views including HTML views, PDF and ePub downloads, according to the available data) and Abstracts Views on Vision4Press platform.
Data correspond to usage on the plateform after 2015. The current usage metrics is available 48-96 hours after online publication and is updated daily on week days.
Initial download of the metrics may take a while.