Fig. 1
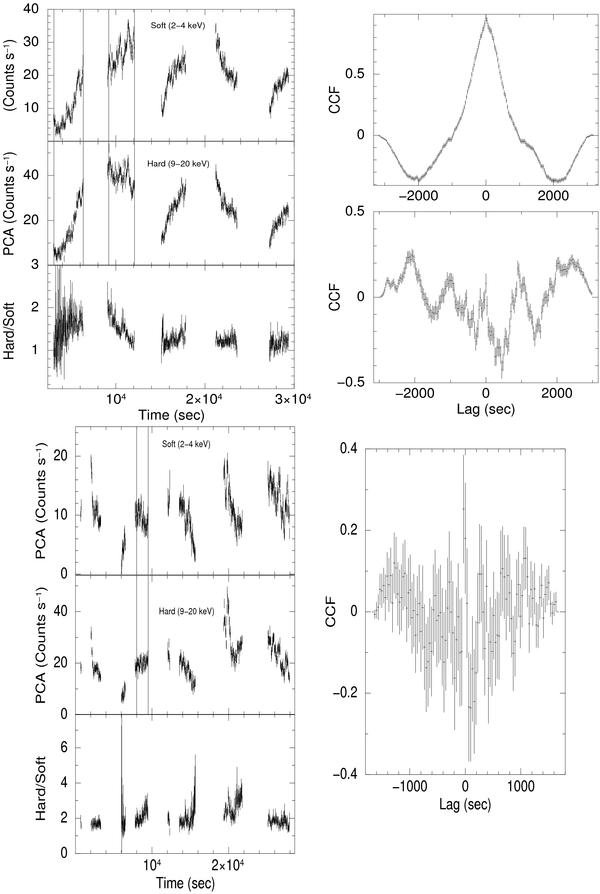
Top: the PCA soft (2−4 keV) and hard (9−20 keV) X-ray light curves of AM Her, along with the hardness ratios (ratios of 9−20 keV counts to 2−4 keV counts), are shown for ObsId 30007-01-01-00. The vertical lines in the light curves represent the sections used in our cross-correlation study. The cross-correlation functions (CCF) for the first and second sections are displayed in the two top-right panels, respectively. Bottom: similar to the top panel but for ObsId 20010-01-01-030.
Current usage metrics show cumulative count of Article Views (full-text article views including HTML views, PDF and ePub downloads, according to the available data) and Abstracts Views on Vision4Press platform.
Data correspond to usage on the plateform after 2015. The current usage metrics is available 48-96 hours after online publication and is updated daily on week days.
Initial download of the metrics may take a while.