Fig. 9
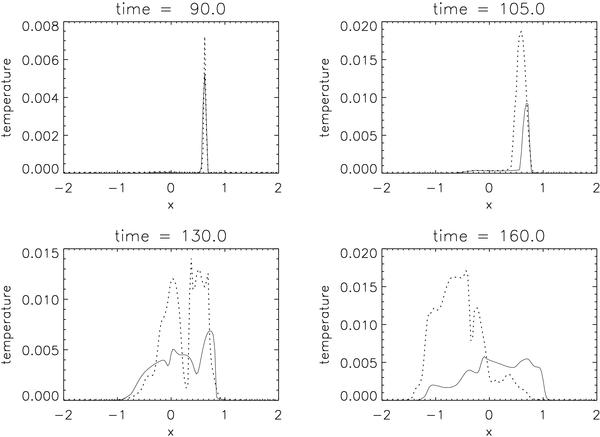
Temperature profiles along the x direction at position y = 0 and z = 0. The solid line is with thermal conduction and the dotted line is without conduction. These results were obtained with the normalisation L0 = 106 m, B0 = 2 × 10⁻³ T and ρ0 = 1.67 × 10⁻¹² kg m-3. This leads to a time normalisation of t0 = 0.7 s and a temperature normalisation of T0 = 2.31 × 10⁸ K. Without thermal conduction the result is independent of the normalisation used, as can be seen when compared to Fig. 3. The dimensional values of max(T) with thermal conduction are 1.92 MK at time 90, 2.12 MK at time 105, 1.57 MK at time 130, and 1.46 MK at time 160.
Current usage metrics show cumulative count of Article Views (full-text article views including HTML views, PDF and ePub downloads, according to the available data) and Abstracts Views on Vision4Press platform.
Data correspond to usage on the plateform after 2015. The current usage metrics is available 48-96 hours after online publication and is updated daily on week days.
Initial download of the metrics may take a while.