Fig. 6
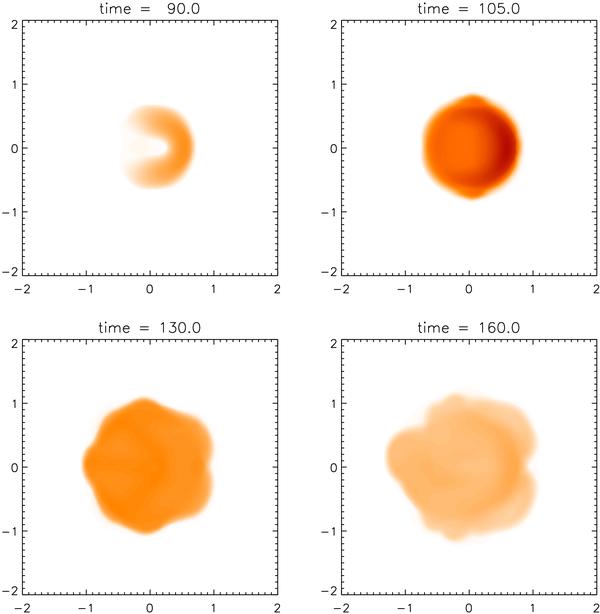
Temperature on the plane perpendicular to the z axis at position z = 0. The temperature was measured for the case with thermal conduction. The colour scale is the same as in Fig. 5. The solid line in Fig. 3 shows the data along a cut through the centre of the plane along the x direction. As in Fig. 3, the temperature was multiplied by 10.0 to fit on the same scale as Fig. 5.
Current usage metrics show cumulative count of Article Views (full-text article views including HTML views, PDF and ePub downloads, according to the available data) and Abstracts Views on Vision4Press platform.
Data correspond to usage on the plateform after 2015. The current usage metrics is available 48-96 hours after online publication and is updated daily on week days.
Initial download of the metrics may take a while.