Fig. 3
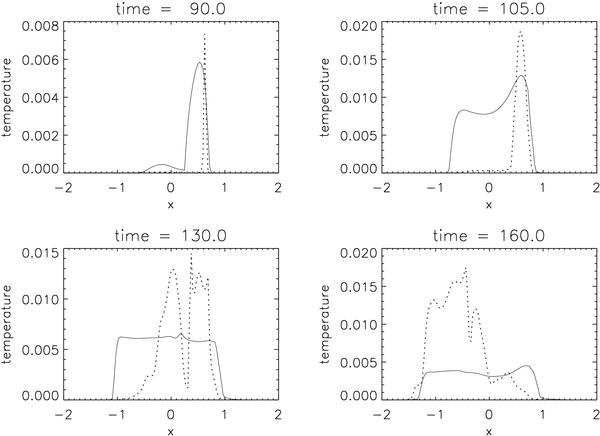
Normalised temperature profiles along the x direction at position y = 0 and z = 0. The solid line is with thermal conduction and the dotted line is without conduction. The temperature obtained with conduction has been multiplied by 10.0 to fit on the same scale as the dotted line. The dimensional values of the maximum temperature with thermal conduction are 8.42 MK at time 90, 18.39 MK at time 105, 9.49 MK at time 130, and 6.73 MK at time 160.
Current usage metrics show cumulative count of Article Views (full-text article views including HTML views, PDF and ePub downloads, according to the available data) and Abstracts Views on Vision4Press platform.
Data correspond to usage on the plateform after 2015. The current usage metrics is available 48-96 hours after online publication and is updated daily on week days.
Initial download of the metrics may take a while.