Fig. 6
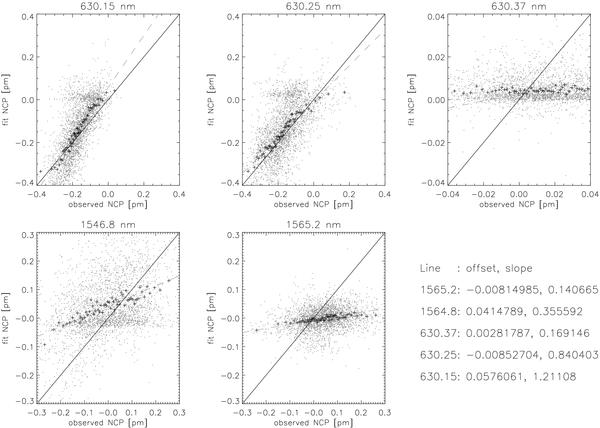
Scatterplots of NCP on the limb-side in the observed and best-fit spectra. Grey dots show all data points, black pluses the same with binning. The grey dashed lines are linear regression lines with the results for offset and slope as given in the lower right.
Current usage metrics show cumulative count of Article Views (full-text article views including HTML views, PDF and ePub downloads, according to the available data) and Abstracts Views on Vision4Press platform.
Data correspond to usage on the plateform after 2015. The current usage metrics is available 48-96 hours after online publication and is updated daily on week days.
Initial download of the metrics may take a while.