Fig. 4
 of
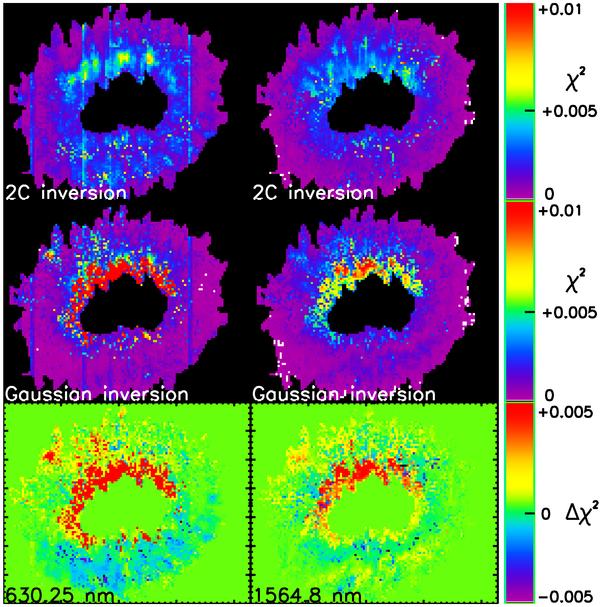
the two inversion methods. Top row:
of
630.25 nm in the 2-component inversion (left), same for 1564.8 nm
(right). Middle row: same as above for the
Gaussian inversion. Bottom row: difference of
between
the Gaussian and 2C inversion. Negative values indicate a better fit quality of the
Gaussian inversion.
of
the two inversion methods. Top row:
of
630.25 nm in the 2-component inversion (left), same for 1564.8 nm
(right). Middle row: same as above for the
Gaussian inversion. Bottom row: difference of
between
the Gaussian and 2C inversion. Negative values indicate a better fit quality of the
Gaussian inversion.
Current usage metrics show cumulative count of Article Views (full-text article views including HTML views, PDF and ePub downloads, according to the available data) and Abstracts Views on Vision4Press platform.
Data correspond to usage on the plateform after 2015. The current usage metrics is available 48-96 hours after online publication and is updated daily on week days.
Initial download of the metrics may take a while.