Fig. 3
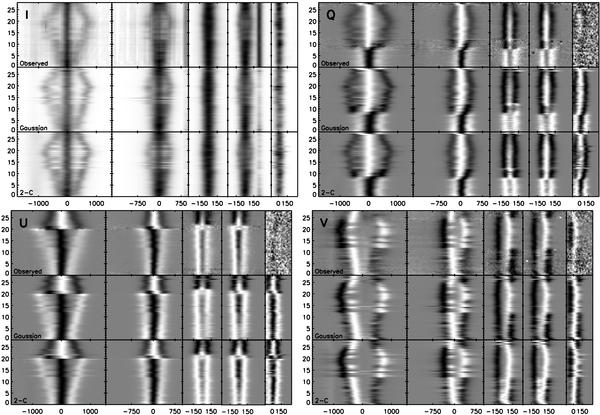
Spectra of a spatial cut along the neutral line of Stokes V. Clockwise, starting left top: Stokes IQVU. Each subpanel shows the observed spectra in the top row, the best-fit profiles of the Gaussian inversion in the middle row, and those of the 2C inversion in the bottom row. Left to right in each subpanel: 1564.8 nm, 1565.2 nm, 630.15 nm, 630.25 nm, 630.37 nm. The x-axis (dispersion) is in mÅ, the y-axis (spatial position along the cut) in arcsec. All profiles were normalized individually to improve the visibility of the spectral patterns; the range is ±1.
Current usage metrics show cumulative count of Article Views (full-text article views including HTML views, PDF and ePub downloads, according to the available data) and Abstracts Views on Vision4Press platform.
Data correspond to usage on the plateform after 2015. The current usage metrics is available 48-96 hours after online publication and is updated daily on week days.
Initial download of the metrics may take a while.