Fig. B.1
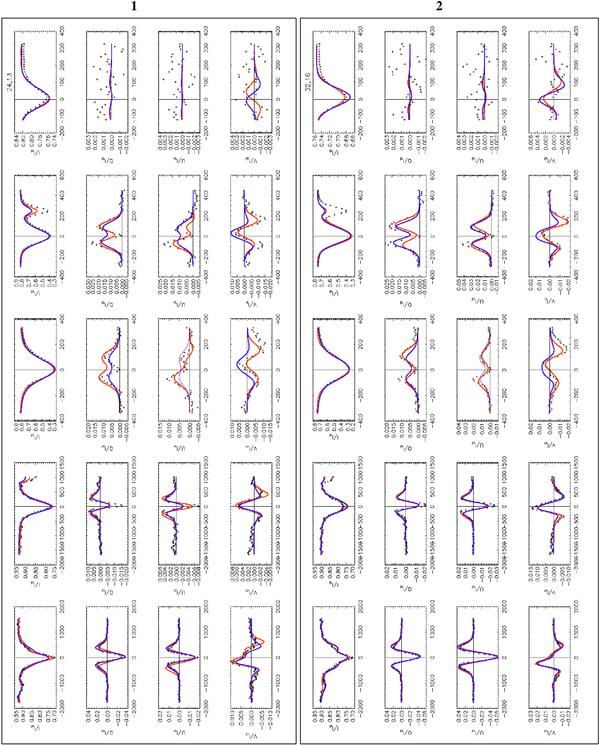
Profile examples showing the observed spectra (black crosses), the best-fit of the 2C inversion (blue line), and the best-fit of the Gaussian inversion (red line). In each panel, Stokes IQUV are shown from left to right, and the lines 1564.8 nm, 1565.2 nm, 630.15 nm, 630.25 nm, and 630.37 nm from bottom to top. The locations of the profiles inside the FOV are marked by crosses in Fig. 1.
Current usage metrics show cumulative count of Article Views (full-text article views including HTML views, PDF and ePub downloads, according to the available data) and Abstracts Views on Vision4Press platform.
Data correspond to usage on the plateform after 2015. The current usage metrics is available 48-96 hours after online publication and is updated daily on week days.
Initial download of the metrics may take a while.