Fig. 3
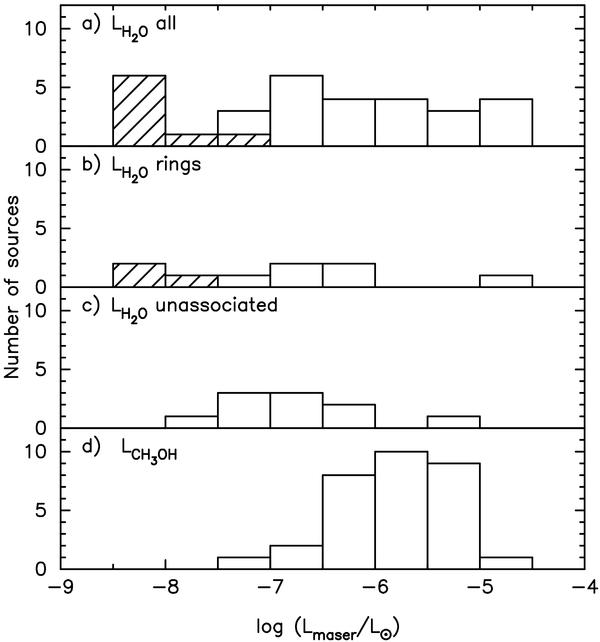
a) Histogram of the water maser luminosity in the 6.7 GHz methanol maser sample (Table 4. The dashed bars mark sources with the upper luminosity limits (non detections). b) Same as in a) but for the sources with ring-like distribution of methanol emission. c) Same as in a) but for the water maser sources not associated with the methanol masers. d) Histograms of methanol maser luminosity in the sample.
Current usage metrics show cumulative count of Article Views (full-text article views including HTML views, PDF and ePub downloads, according to the available data) and Abstracts Views on Vision4Press platform.
Data correspond to usage on the plateform after 2015. The current usage metrics is available 48-96 hours after online publication and is updated daily on week days.
Initial download of the metrics may take a while.