Fig. 1
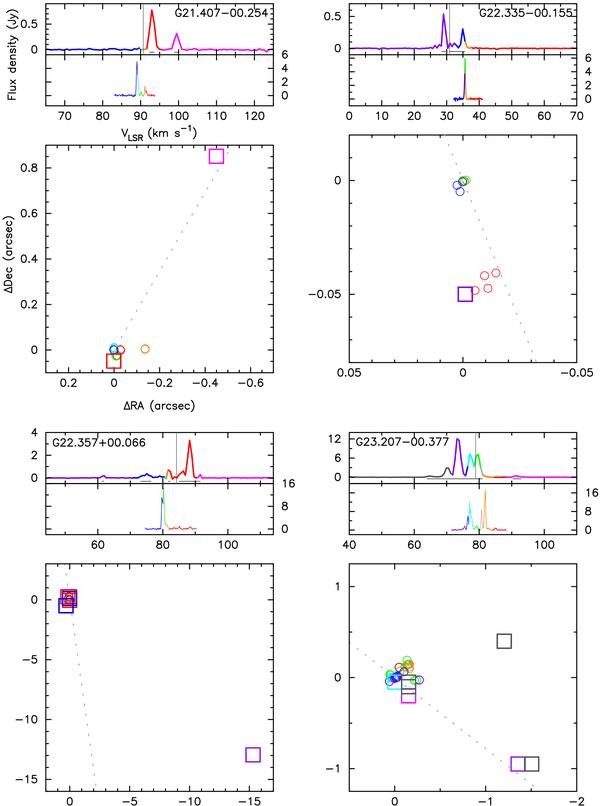
Spectra and maps of the 22 GHz water (VLA) and 6.7 GHz methanol (EVN) maser emission. The upper and lower panels correspond to the water and methanol maser spectra, respectively. The thin bars under the spectra show the velocity ranges of the displayed water maser spots. The thin grey lines represent the systemic velocities of sources (Table 4). Each square represents a 22 GHz water maser spot observed in a single channel. Note that the typical absolute positional uncertainty of water emission is 0 15. The circles represent the 6.7 GHz methanol maser spots from Bartkiewicz et al. (2009) with the absolute positional accuracy of a few mas. The colours of squares and circles relate to the LSR velocities as indicated in the spectra. The coordinates are relative to the brightest spots of methanol emission (Table 1). Note that the source names are the Galactic coordinates of the brightest spot of the methanol maser. The dotted lines correspond to the PAMIR of 4.5 μm counterparts as listed in Table 2. The colour version is available on-line.
Current usage metrics show cumulative count of Article Views (full-text article views including HTML views, PDF and ePub downloads, according to the available data) and Abstracts Views on Vision4Press platform.
Data correspond to usage on the plateform after 2015. The current usage metrics is available 48-96 hours after online publication and is updated daily on week days.
Initial download of the metrics may take a while.