Fig. 5
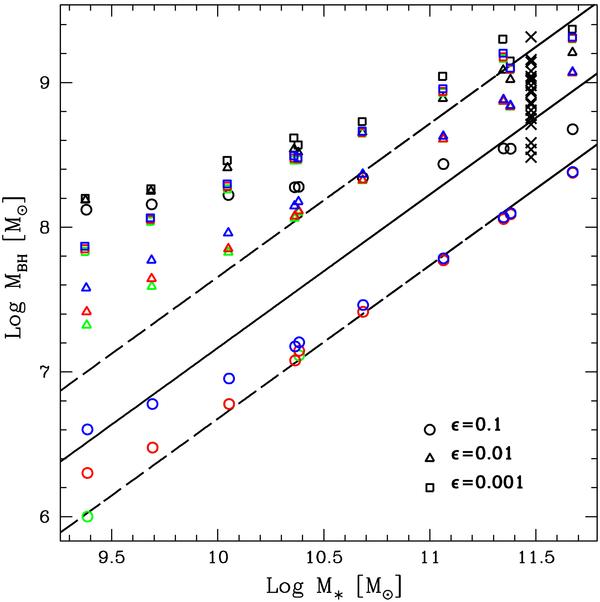
Final SMBH mass versus final stellar mass for all the explored models. The solid line is the Marconi & Hunt (2003) best-fit of the Magorrian (1998) relation, and the two dashed lines represent the associated 1-σ deviation. Different colors indicate different initial masses of the MBH, i.e. 103 M⊙ (green), 105 M⊙ (red, models in Table 3), 106 M⊙ (blue), and 108 M⊙ (black, models in Table 2). Different symbols identify the adopted value for radiative efficiency: ϵ = 0.1 (circles), ϵ = 0.01 (triangles), and ϵ = 0.001 (squares). The black crosses are the hydrodynamical models in Table 1 of Ciotti et al. (2010).
Current usage metrics show cumulative count of Article Views (full-text article views including HTML views, PDF and ePub downloads, according to the available data) and Abstracts Views on Vision4Press platform.
Data correspond to usage on the plateform after 2015. The current usage metrics is available 48-96 hours after online publication and is updated daily on week days.
Initial download of the metrics may take a while.