Fig. 8
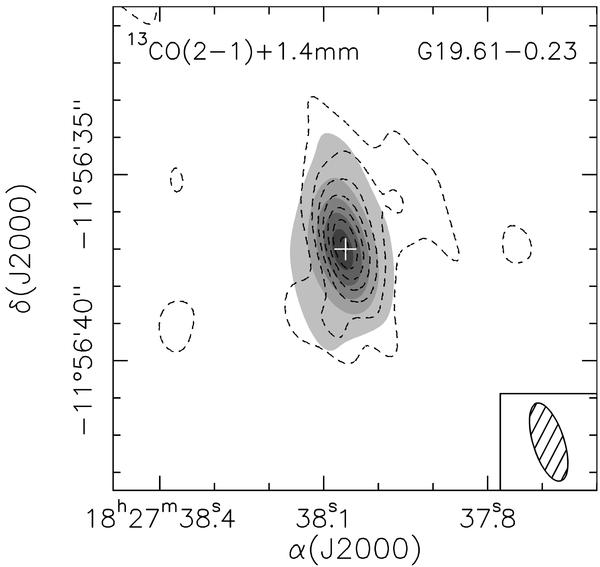
Overlay of the 13CO (2–1) averaged absorption (dashed contours) on the 1.4 mm continuum emission (grayscale). The absorption has been averaged over the velocity interval 41.6–54.1 km s-1. Negative contours range from −0.1 to −0.7 Jy beam-1 in steps of −0.1 Jy beam-1 (1σ ≃ 0.03 Jy beam-1). Grayscale contours for the continuum emission are the same as in Fig. 1. The white cross marks the position of the 1.4 mm continuum emission peak. The synthesized beam is shown in the lower righthand corner.
Current usage metrics show cumulative count of Article Views (full-text article views including HTML views, PDF and ePub downloads, according to the available data) and Abstracts Views on Vision4Press platform.
Data correspond to usage on the plateform after 2015. The current usage metrics is available 48-96 hours after online publication and is updated daily on week days.
Initial download of the metrics may take a while.