Fig. 7
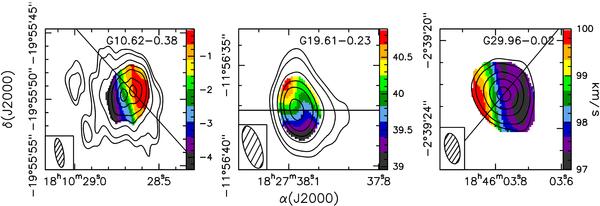
Overlay of the PdBI CH3CN (12–11) emission averaged under the K = 0, 1, 2, and 3 components (contours) on the CH3CN (12–11) line peak velocity obtained with a Gaussian fit (colors) towards the cores G10 (left), G19 (middle), and G29 (right). The color levels in km s-1 are indicated in the wedge to the right of each panel. Contours for CH3CN (12–11) are the same as in Fig. 1. The straight line indicates the direction of the molecular outflow (Keto & Wood 2006; this paper). The synthesized beam is shown in the lower lefthand corner.
Current usage metrics show cumulative count of Article Views (full-text article views including HTML views, PDF and ePub downloads, according to the available data) and Abstracts Views on Vision4Press platform.
Data correspond to usage on the plateform after 2015. The current usage metrics is available 48-96 hours after online publication and is updated daily on week days.
Initial download of the metrics may take a while.