Fig. 5
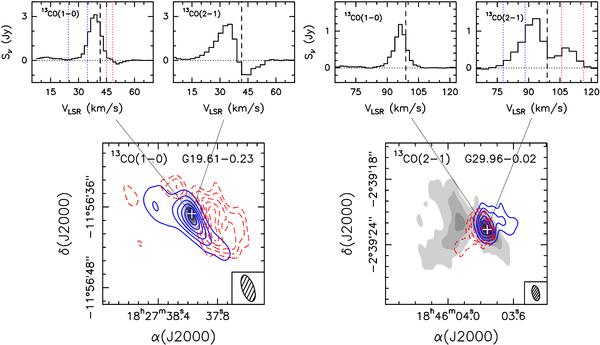
Bottom panels: blueshifted (blue solid contours) and redshifted (red dashed contours) 13CO (1–0) (left) and 13CO (2–1) (right) averaged emission overlaid on the 1.4 mm continuum emission (grayscale) towards G19 and G29, respectively. The velocity intervals for which the blueshifted and redshifted emission have been averaged are indicated in blue and red dotted vertical lines in the corresponding upper spectra. Contour levels are 0.05, 0.1, 0.15, 0.2, 0.25, 0.3, and 0.35 Jy beam-1 (1σ ≃ 7 mJy beam-1) for the 13CO (1–0) blueshifted emission and 0.15, 0.2, 0.25, 0.3, and 0.35 Jy beam-1 (1σ ≃ 50 mJy beam-1) for the 13CO (1–0) redshifted emission (G19), and 0.03, 0.09, 0.15, 0.27, 0.39, and 0.51 Jy beam-1 (1σ ≃ 7 mJy beam-1) for the 13CO (2–1) blueshifted emission and 0.03, 0.06, 0.09, 0.15, 0.3 and 0.45 Jy beam-1 (1σ ≃ 7 mJy beam-1) for the 13CO (2–1) redshifted emission (G29). Grayscale contours for the continuum emission are the same as in Fig. 1. The synthesized beam is shown in the lower righthand corner. The white cross marks the position of the 1.4 mm continuum emission peak. Top panels: 13CO (1–0) and (2–1) spectra taken towards the 1.4 mm continuum emission peak of the G19 (left) and G29 (right) cores. The dashed vertical line indicates the systemic velocity of each core.
Current usage metrics show cumulative count of Article Views (full-text article views including HTML views, PDF and ePub downloads, according to the available data) and Abstracts Views on Vision4Press platform.
Data correspond to usage on the plateform after 2015. The current usage metrics is available 48-96 hours after online publication and is updated daily on week days.
Initial download of the metrics may take a while.