Fig. 2
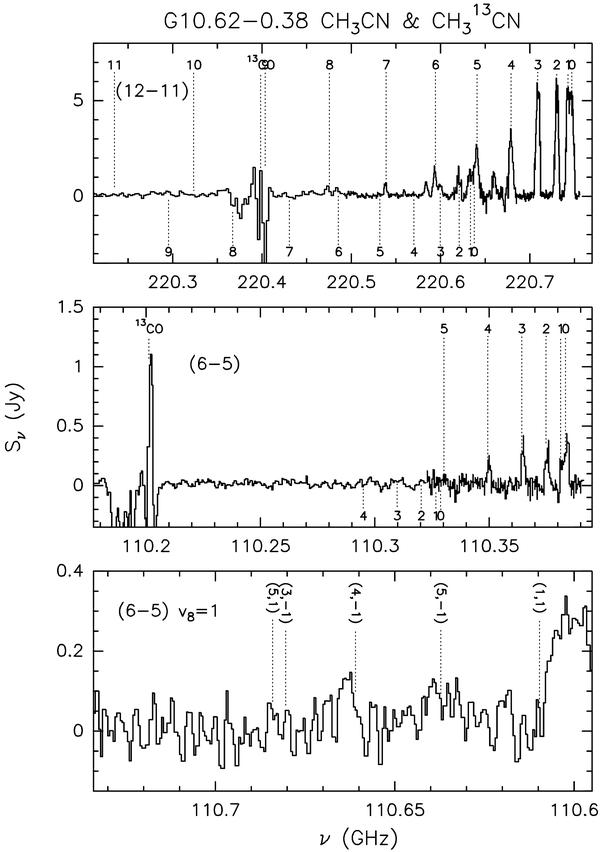
Methyl cyanide spectra obtained by integrating the emission inside the 3σ contour level area at 2.7 and 1.4 mm towards G10 as seen with the PdBI. We show in the top CH3CN (12–11), in the middle CH3CN (6–5), and in the bottom CH3CN (6–5) vibrationally excited (v8 = 1). The different K-components (top and middle panels) are marked with dashed lines in the upper (lower) part of each spectra in the case of CH3CN (CH313CN). Different K-components of a same transition may have different spectral resolution because they were observed with different correlator units. Only the analyzed lines are labeled.
Current usage metrics show cumulative count of Article Views (full-text article views including HTML views, PDF and ePub downloads, according to the available data) and Abstracts Views on Vision4Press platform.
Data correspond to usage on the plateform after 2015. The current usage metrics is available 48-96 hours after online publication and is updated daily on week days.
Initial download of the metrics may take a while.