| Issue |
A&A
Volume 525, January 2011
|
|
|---|---|---|
| Article Number | A118 | |
| Number of page(s) | 5 | |
| Section | Extragalactic astronomy | |
| DOI | https://doi.org/10.1051/0004-6361/201014987 | |
| Published online | 07 December 2010 | |
Synchrotron radio emission in radio-quiet AGNs
1
ISDC Data Centre for Astrophysics, ch. d’Ecogia 16,
1290
Versoix,
Switzerland
2
Geneva Observatory, Geneva University,
ch. des Maillettes
51, 1290
Sauverny,
Switzerland
e-mail: This email address is being protected from spambots. You need JavaScript enabled to view it.
; This email address is being protected from spambots. You need JavaScript enabled to view it.
Received:
14
May
2010
Accepted:
15
October
2010
Abstract
The basic mechanism responsible for radio emission in radio-loud active galactic nuclei (AGNs) is assumed to be synchrotron radiation. We suggest here that radio emission in radio-quiet objects is also due to synchrotron radiation of particles accelerated in shocks. We consider generic shocks and study the resulting synchrotron properties. We estimate the synchrotron radio luminosity and compare it with the X-ray component produced by inverse Compton emission, and find that the radio-to-X-ray luminosity ratio is much less than unity, with values typical of radio-quiet sources. The predicted trends in source parameters, black hole mass, and accretion rate may account for the anticorrelation between radio loudness and Eddington ratio observed in different AGN samples.
Key words: accretion, accretion disks / radiation mechanisms: non-thermal / galaxies: active / radio continuum: galaxies / radiation mechanisms: thermal
© ESO, 2010
1. Introduction
The relative importance of radio emission compared to the other wavebands can vary significantly in different active galactic nuclei (AGN) classes. This leads to the well-known radio-loud/radio-quiet dichotomy. The distinction between radio-loud and radio-quiet objects is based on the radio loudness parameter, R = Fr/Fo, defined as the ratio of monochromatic luminosities at 5 GHz and optical B band at 4400 Å. The resulting distribution of the R parameter in the Palomar Bright Quasar Survey suggests there are two distinct classes (Kellermann et al. 1989): radio-quiet (R ~ 0.1−1) and radio-loud (R ~ 10−1000). Radio-loud AGNs are on average ~103 times brighter in the radio band than radio-quiet sources. The classical boundary between the two populations is formally set at R ~ 10 (Kellermann et al. 1994).
An alternative way to quantify the radio loudness of a source is to compare the radio and X-ray emission components. Terashima & Wilson (2003) have introduced a new parameter (RX) as a measure of the radio loudness by taking the ratio of the 5 GHz radio luminosity to the 2–10 keV X-ray luminosity,  . It has been shown that RX is well correlated with the classical radio loudness parameter R, with the advantage that the hard X-ray band is not affected by extinction, and thus can also be used for heavily obscured sources (Terashima & Wilson 2003). Based on the RX parameter, the boundary between radio-loud and radio-quiet classes is redefined at log RX = −2.755 ± 0.015 (Panessa et al. 2007).
Whether there is any bimodality in the radio loudness distribution is still a debated question. Radio-loud objects only form a minority of the AGN population, of the order of ~10%, whereas the majority of sources is radio-quiet. In radio-loud objects, radio emission is believed to originate in a relativistic jet, but the origin of radio emission in radio-quiet objects has not been clearly established yet.
We investigate here whether synchrotron radiation of relativistic electrons gyrating in a magnetic field could be the physical mechanism responsible for radio emission in radio-quiet objects. This implies that particle acceleration takes place in the central regions of AGNs. One of the well-known mechanisms for particle acceleration is acceleration in shocks (e.g. Kirk 1994). Shocks are known to be an efficient mechanism for accelerating particles up to relativistic energies, with energy being drawn from the bulk kinetic energy of the flow itself. This may account for relativistic particles contributing to the non-thermal component of the AGN continuum. In the presence of magnetic fields, somehow accreted with infalling matter, accelerated particles will give rise to synchrotron emission. Here we discuss the synchrotron radio emission resulting from generic shocks, independently of the physical origin of the shock itself. In particular, we consider the possible role of shocks in the generation of radio emission in radio-quiet AGNs.
The paper is organized as follows. We first introduce generic shocks in Sect. 2. We then derive the radio properties of the synchrotron radiation emitted by shock-accelerated electrons (Sect. 3) and compare the resulting radio luminosity with the X-ray luminosity produced by inverse Compton emission (Sect. 4). Model results are compared with observations in Sect. 5. We also discuss aspects related to the relative strength of radio emission in different AGN classes, and conclude that synchrotron emission of electrons accelerated in shocks is a likely explanation of the radio emission of radio-quiet AGNs (Sect. 6).
2. Shocks
The complex dynamics of accreting matter close to the central black hole is likely to induce dissipative processes in the accretion flow, and shocks are naturally expected in such an environment. Shocks may be expected in widely different contexts, from accretion disc models (Blandford 1994) to more chaotic accretion scenarios (Courvoisier & Türler 2005; Ishibashi & Courvoisier 2009a). Here we consider shocks as a mechanism of particle acceleration, and study the resulting synchrotron radio emission, regardless of the details of any specific model.
We consider shocks occurring around ~100 Schwarzschild radii from the central black hole. The radial distance is given in units of the Schwarzschild radius: R = ζRS, and ζ100 = ζ/100. We parametrize the black hole mass and the accretion rate with typical values of radio-quiet AGNs, such as Seyfert galaxies: the black hole mass is expressed in units of MBH = M8 × 108 M⊙, and the accretion rate in units of Ṁ = Ṁ0 × 1 M⊙/yr.
We assume that a small fraction of accreted matter undergoes efficient shock acceleration. Particles can cross the shock front several times, with an average energy gain. The acceleration process is stochastic and the resulting particle distribution function is described by a power law with index p. In the optically thin regime, the synchrotron emission is characterized by a power law of the form ν−(p−1)/2, whereas the emission is self-absorbed at low frequencies. The optically thick regime is predicted to form a rising spectrum of the form ν5/2 (synchrotron self-absorption).
3. Synchrotron radiation
3.1. Synchrotron radio luminosity
The synchrotron power emitted by a single particle is given by (Rybicki & Lightman 1979) 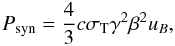 (1)where
  is the magnetic energy density, with the magnetic field B expressed in units of Gauss. The shape of the synchrotron spectrum is characterized by a peak at a critical frequency
 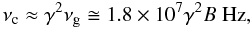 (2)where
  is the gyro-frequency of a non-relativistic electron.
To obtain the total power emitted by a population of electrons, we integrate Eq. (1) over the electron distribution function N(γ): 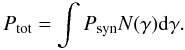 (3)Within the shock acceleration scenario, a combination of energy gain and escape probability leads to a power-law distribution in energy for the accelerated particles. We thus assume a power-law distribution in energy for the electron population
 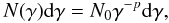 (4)where p is the power-law index of the electron distribution function. Introducing upper and lower cut-offs to the electron distribution, the synchrotron luminosity is given by
 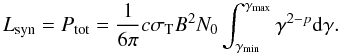 (5)From Eq. (5) we see that the integral is dominated by the upper cut-off for indices p < 3. Observations of synchrotron sources generally indicate indices in the range p ~ 2.0−2.4. The power-law index depends on the shock properties; in the case of strong shocks, p = 2, while Monte Carlo simulations of ultra-relativistic shocks yield p = 2.2−2.3 (Achterberg et al. 2001; Gallant 2002, and references therein). Thus the power-law index is always less than 3, and here we adopt the value of p = 2.2. The synchrotron luminosity (Eq. (5)) can thus be approximated by
 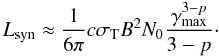 (6)In order to evaluate Lsyn, we need estimates of the magnetic field strength, the maximal γ-factors of the electrons, and the normalization of the electron distribution function.
In general, a direct measurement of the magnetic field in the central regions of galaxies is difficult to obtain. This is particularly true for radio-quiet sources. In these objects, radio emission is comparatively weak and the infrared component is dominated by thermal emission from dust, thus precise estimates of the magnetic field are not available. Indirect estimates can in principle be obtained from observable quantities, such as the measured characteristic frequency, the electron cooling time or parameters of the synchrotron peak. Courvoisier et al. (1988) obtained a quantitative estimate of the magnetic field in 3C 273, during a synchrotron flare. The inferred value was B ~ 0.7 G. More recently, magnetic fields in the range B ~ 0.01−0.1 G have been reported in five high frequency peaker radio sources, based on VLBA observations (Orienti & Dallacasa 2008). In the following, we parametrize the magnetic field to a typical value of ~0.1 G (B = B0.1 × 0.1 G).
A rough estimate of the maximal γ-factor of the electrons can be derived from the break observed in the far-infrared spectral energy distributions (SEDs) of radio-quiet AGNs. Radio-quiet objects show a characteristic fall-off from strong infrared to weak radio emissions, corresponding to the transition from thermal emission in the infrared to non-thermal synchrotron radiation in the radio domain (Bregman 1994). In radio-quiet sources, the emission dominating the mid/far infrared region is attributed to thermal emission from the dust component, while the synchrotron contribution becomes negligible in this spectral range (Polletta et al. 2000). Haas et al. (2000) analysed the infrared to millimetre SEDs of 17 Palomar Green (PG) quasars and found a decline starting near 100 μm, followed by a steep fall-off towards the mm region. From the observed SEDs, we can see that the turnover occurs somewhere in the mm-cm region. Assuming a cut-off frequency of ~1010 Hz, we obtain a corresponding maximal γ-factor of ~100 (γ ~ γ100 × 100). Indeed, electrons with γ-factors of this order are needed to explain the radio emission in typical synchrotron-emitting regions.
In general, only a small fraction of the particles are efficiently accelerated in the shocks to reach the required high-γ values. Courvoisier & Camenzind (1989) estimated that a few percent of the total number of electrons arriving in the shock region need to be accelerated to relativistic energies to explain the synchrotron radiation in 3C 273. We thus normalize the electron distribution function (Eq. (4)) as 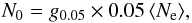 (7)where
  is the average number of electrons present in the region, where tdyn is the time spent by the electrons in the synchrotron active region, which is given by the local free-fall time.
Combining the above arguments and inserting numerical values in Eq. (6), we obtain an estimate of the synchrotron luminosity  (8)We note that the radio luminosity is LR ~ 1039 erg/s and is proportional to the black hole mass and accretion rate, LR ∝ ṀMBH.
3.2. Synchrotron self-absorption
Synchrotron radiation is known to be self-absorbed below a critical transition frequency, producing the inverted spectrum observable at lower frequencies. The synchrotron self-absorption coefficient for a power-law distribution of accelerated particles is derived in Rybicki & Lightman (1979). Following the notation given in Laor & Behar (2008), the absorption coefficient αν can be written as 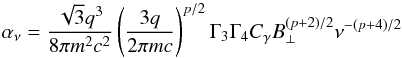 (9)where Γ3 and Γ4 are as defined in Laor & Behar (2008), and Cγ is given by the normalization of the relativistic electron energy distribution. The total number density of relativistic electrons is obtained by integrating over the energy range between γmin and γmax
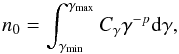 (10)where n0 = g0.05 × 0.05 ne is the fraction of accelerated electrons per unit volume. Since the power law index of the electron distribution function is always larger than two (p = 2.2), the integral in Eq. (10) is dominated by the lower cut-off that we parametrize by γmin ~ γ5 × 5.
The optical depth for synchrotron radiation is given by the absorption coefficient and the typical size (R ~ 100RS) of the shock region 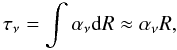 (11)and is
  (12)We see that the medium is optically thick at a frequency of ~1 GHz, and thus the central core is expected to be self-absorbed and opaque at low frequencies.
The transition frequency, where the optical depth becomes equal to unity (τν ~ 1), is roughly given by  (13)The transition from the optically thick to the optically thin regimes is typically located around a few tens of GHz. We thus expect a compact, absorbed core in the nuclei of radio-quiet AGNs at ~GHz frequencies. However, the precise value of the turnover frequency depends on the source parameters and the shock properties. Inhomogeneities in the magnetic field and superpositions of different shock events lead to a broad distribution of transition frequencies, with α < 2.5 over a broad frequency domain. On the other hand, the importance of synchrotron self-absorption steeply declines with increasing frequency, and the source becomes rapidly transparent at higher frequencies. At these high frequencies, we might then be able to directly see the inner optically thin synchrotron emitting region, although thermal emission from the dust component becomes important in radio-quiet sources.
4. A measure of radio loudness: the radio-to-X-ray luminosity ratio
The physical process at the origin of X-ray emission is assumed to be the Compton upscattering of optical/UV photons. In standard accretion disc models, the seed luminosity is given by the disc luminosity, Lseed = ϵṀc2. Alternatively, the seed photons can be generated in optically thick shocks, with the average UV luminosity given by 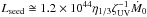 erg/s, in the clumpy accretion scenario (Ishibashi & Courvoisier 2009a). The resulting X-ray variability and spectral properties have been previously discussed (Ishibashi & Courvoisier 2009b, 2010). Independently of the origin of the seed photons, we here parametrize the photon luminosity by the typical value of the optical/UV luminosity, Lseed = Ls × 1044 erg/s, such as observed in Seyfert galaxies. Assuming an equilibrium situation, the electron temperature is determined by the balance between Coulomb heating and Compton cooling. The Compton cooling rate in the non-relativistic limit is given by
 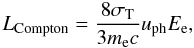 (14)where uph is the energy density of seed photons. The Coulomb heating rate is defined as
 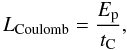 (15)where tC is the standard Coulomb energy transfer time. The average electron energy is obtained by the equilibrium condition (LCoulomb = LCompton)
 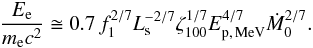 (16)The resulting electron temperature is a few hundred keV, and the Compton cooling of the electrons gives rise to X-ray emission. The average X-ray luminosity is of the order of
  (17)We compute the radio-to-X-ray luminosity ratio, LR/LX, using Eq. (8) and the X-ray luminosity calculated in Eq. (17). The resulting LR/LX ratio is given by
 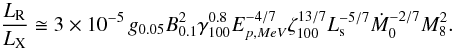 (18)We observe that the radio-to-X-ray luminosity ratio is always much lower than unity, implying that the synchrotron luminosity is only a small fraction of the inverse Compton luminosity. The seed photon luminosity is expected to be correlated with the accretion rate. Assuming that the optical/UV luminosity is directly proportional to the accretion rate, the radio-to-X-ray luminosity ratio scales as
 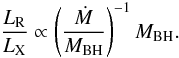 (19)We note that the radio-to-X-ray luminosity ratio is higher for large black hole mass and/or low Eddington ratio, since
  .
.
5. Comparison with observations
Sikora et al. (2007) analyse the distribution of radio luminosities in different AGN classes and study the dependence of radio loudness on source parameters, i.e. black hole mass and accretion rate. Plotting the radio loudness parameter versus the Eddington ratio, they find that AGNs form two distinct sequences, termed radio-quiet and radio-loud, respectively. The total radio luminosities at 5 GHz (LR = ν5 × Lν5) measured in Seyfert galaxies and PG quasars lie in the range 1038−1040 erg/s. In contrast, the radio luminosities of radio-loud quasars are two to three orders of magnitude higher (LR > 1042 erg/s). Thus the radio luminosity we estimated in Eq. (8), LR ~ 1039 erg/s, falls within the range observed in radio-quiet sources.
The dependence of the radio luminosity on source parameters has been investigated by Lacy et al. (2001), with particular reference to the FIRST bright quasar survey (FBQS). These objects have radio luminosities midway between radio-quiet and radio-loud classes, and they are thought to fill the gap between radio-loud and radio-quiet quasars in the radio luminosity vs. optical luminosity plane. The empirical scaling of radio luminosity on black hole mass and accretion rate, obtained by fitting the combined data from the FBQS and PG samples, takes the form 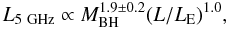 (20)at accretion rates of L/LE ~ 0.1. The Eddington luminosity scales with black hole mass (LE ∝ MBH) and assuming that the bolometric luminosity is proportional to the accretion rate (L ∝ Ṁ), the above empirical relation can be re-written as
 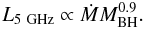 (21)In our case, the model dependence of the radio luminosity is of the form
 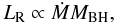 (22)quite similar to the empirical relation found by Lacy et al. (2001).
Concerning the spectral shape of the radio emission, high-resolution, multi-frequency, radio measurements for radio-quiet objects are still relatively rare (Middelberg et al. 2004; Ulvestad et al. 2005) compared to the well-studied radio-loud AGNs. Here we briefly summarise a number of VLA and VLBI radio observations of Seyfert galaxies and radio-quiet quasars. A sample of nearby Seyfert galaxies from the Palomar spectroscopic survey has been observed with VLA at two frequencies (6 cm and 20 cm) and roughly half of these low-luminosity Palomar Seyfert galaxies turn out to have flat or inverted spectra (Ho & Ulvestad 2001; Ulvestad & Ho 2001). Similarly, Nagar et al. (2000) found that at least 15 of the 18 detected radio cores from a sample of low-luminosity AGNs, observed with the high-frequency VLA, have flat or inverted spectra. More recently, dual VLBI observations of Seyfert galaxies at 6cm and 18cm and supplemented by a literature search have been performed by Middelberg et al. (2004). This results in a majority (81%) having at least one flat or inverted spectrum VLBI component. The values of the spectral index for Seyfert galaxies range between −0.3 < α < +2.5. Barvainis et al. (1996) analysed the radio spectra of radio-quiet quasars with the VLA, and concluded that roughly 40% of radio-quiet quasars have flat or inverted spectra cores, quite similar to those observed in radio-loud quasars.
The flat spectra cores observed in radio-loud sources are usually interpreted in terms of a superposition of distinct synchrotron self-absorbed components becoming opaque at different frequencies (Kellermann & Pauliny-Toth 1969). Recent radio variability analysis also suggests that the flat or inverted spectra found in radio-quiet objects are the result of partially opaque synchrotron cores, analogous to those found in the radio-loud counterparts (Barvainis et al. 2005). Thus the flat spectrum components observed in radio-quiet sources might indicate an opaque, self-absorbed central region. The observed radio morphology of these objects is usually dominated by an unresolved, compact core, with the radio-emitting region often confined to the central core. Our model thus describes the flat core component observed in Seyfert galaxies and radio-quiet quasars. We also note that the presence of absorbed, compact cores in radio-quiet objects seem to be more common than previously thought, as confirmed by the increased detection rate with VLBI-resolution measurements (Middelberg et al. 2004).
The relationship between radio and X-ray emission components has been investigated by several authors (Terashima & Wilson 2003; Panessa et al. 2007). The relative importance of radio emission is quantified by the RX parameter, which can be compared with our model LR/LX luminosity ratio. A mean value of log RX = −3.64 ± 0.16 is reported for a sample of local Seyfert galaxies (Panessa et al. 2007), while a value of LR/LX ~ 10-5 is found for the PG sample, with the X-ray luminosity integrated over the 0.2–20 keV band (Laor & Behar 2008). Thus the observed radio-to-X-ray luminosity ratios of radio-quiet AGNs are very small, ~10-4−10-5, comparable to our predicted low LR/LX ratios.
6. Discussion and conclusion
The importance of radio emission compared to the other emission components has direct implications for the radio loudness distribution and its possible dichotomy. Panessa et al. (2007) redefine the boundaries between radio-loud and radio-quiet classes at log RX = −2.755 ± 0.015, based on the RX parameter. According to this criterion, the predicted LR/LX luminosity ratio corresponds to the radio-quiet category. However, it is observed that even within the radio-quiet sequence, the radio loudness parameter can span several orders of magnitude between PG quasars and Seyfert/LINER objects (Sikora et al. 2007). In our picture, the relative strength of radio emission varies depending on the source parameters. The LR/LX luminosity ratio is higher for large black hole mass and low accretion rate. This may explain the radio loudness of low-luminosity AGN (LLAGNs), which are known to be accreting at very low Eddington rates and are found to be both underluminous and radio-loud (Ho 2002). We may therefore account for the broad range of the radio loudness covered by radio-quiet AGNs.
Shocks discussed here cannot however, account for the much higher radio luminosities observed in radio-loud objects. Indeed the radio loudness parameter of radio-loud AGNs, hosted by giant ellipticals, are up to ~3 orders of magnitude larger (Sikora et al. 2007). In this case, radio emission should have a different origin, most probably related to the presence of a relativistic jet.
A trend toward increasing radio-loudness with decreasing Eddington ratio has been confirmed in numerous studies (Ho 2002; Sikora et al. 2007; Panessa et al. 2007). Specifically, Panessa et al. (2007) report an anticorrelation between radio-loudness and Eddington ratio (expressed as L2−10 keV/LE) followed by a sample of Seyfert galaxies and low-luminosity radio galaxies (LLRG): objects with lower L2−10 keV/LE tend to be radio louder. Sikora et al. (2007) confirm this trend of increasing radio loudness with decreasing Eddington ratio, but in addition note that the trend is followed separately by the radio-quiet and the radio-loud sequences. We have seen that the model LR/LX luminosity ratio is higher for lower values of the Ṁ/MBH parameter. Thus the predicted trends with black hole mass and accretion rate are consistent with observations and may account, at least qualitatively, for the observed R − L/LE anticorrelation.
It is now established that radio-quiet AGNs are not radio-silent and that they do emit some radio emission. But, contrary to the radio-loud case, the physical origin of radio emission in radio-quiet objects is still not well understood. Some authors argue that there are scaled-down and less powerful jets, by analogy with the radio jets observed in the radio-loud counterparts (Ulvestad et al. 2005). Laor & Behar (2008) raise the alternative possibility of magnetic heating by analogy with coronally active stars. In our picture, radio emission is produced by synchrotron cooling of relativistic electrons accelerated in the shocks occurring within the accretion flow. Shocks are known to be a natural site for particle acceleration, and the associated synchrotron radio emission fits naturally into the general picture. The resulting radio-to-X-ray luminosity ratios are very small, with values typical of radio-quiet sources. We therefore suggest that shocks are a possible explanation for the origin of radio emission in radio-quiet AGNs.
References
- Achterberg, A., Gallant, Y. A., Kirk, J. G., & Guthmann, A. W. 2001, MNRAS, 328, 393 [NASA ADS] [CrossRef] [Google Scholar]
- Barvainis, R., Lonsdale, C., & Antonucci, R. 1996, AJ, 111, 1431 [NASA ADS] [CrossRef] [Google Scholar]
- Barvainis, R., Lehár, J., Birkinshaw, M., Falcke, H., & Blundell, K. M. 2005, ApJ, 618, 108 [NASA ADS] [CrossRef] [Google Scholar]
- Blandford, R. D. 1994, in The Physics of Active Galaxies, ed. G. V. Bicknell, M. A. Dopita, & P. J. Quinn, ASP Conf. Ser., 54, 23 [Google Scholar]
- Bregman, J. N. 1994, in Multi-Wavelength Continuum Emission of AGN, ed. T. Courvoisier, & A. Blecha, IAU Symp., 159, 5 [Google Scholar]
- Courvoisier, T., & Camenzind, M. 1989, A&A, 224, 10 [NASA ADS] [Google Scholar]
- Courvoisier, T. J.-L., & Türler, M. 2005, A&A, 444, 417 [NASA ADS] [CrossRef] [EDP Sciences] [Google Scholar]
- Courvoisier, T., Robson, E. I., Hughes, D. H., et al. 1988, Nature, 335, 330 [Google Scholar]
- Gallant, Y. A. 2002, in Relativistic Flows in Astrophysics (Berlin: Springer Verlag), ed. A. W. Guthmann, M. Georganopoulos, A. Marcowith, & K. Manolakou, Lecture Notes in Physics, 589, 24 [Google Scholar]
- Haas, M., Müller, S. A. H., Chini, R., et al. 2000, A&A, 354, 453 [NASA ADS] [Google Scholar]
- Ho, L. C. 2002, ApJ, 564, 120 [NASA ADS] [CrossRef] [Google Scholar]
- Ho, L. C., & Ulvestad, J. S. 2001, ApJS, 133, 77 [NASA ADS] [CrossRef] [Google Scholar]
- Ishibashi, W., & Courvoisier, T. J.-L. 2009a, A&A, 495, 113 [NASA ADS] [CrossRef] [EDP Sciences] [Google Scholar]
- Ishibashi, W., & Courvoisier, T. J.-L. 2009b, A&A, 504, 61 [NASA ADS] [CrossRef] [EDP Sciences] [Google Scholar]
- Ishibashi, W., & Courvoisier, T. J.-L. 2010, A&A, 512, A58 [NASA ADS] [CrossRef] [EDP Sciences] [Google Scholar]
- Kellermann, K. I., & Pauliny-Toth, I. I. K. 1969, ApJ, 155, L71 [NASA ADS] [CrossRef] [Google Scholar]
- Kellermann, K. I., Sramek, R., Schmidt, M., Shaffer, D. B., & Green, R. 1989, AJ, 98, 1195 [NASA ADS] [CrossRef] [Google Scholar]
- Kellermann, K. I., Sramek, R. A., Schmidt, M., Green, R. F., & Shaffer, D. B. 1994, AJ, 108, 1163 [NASA ADS] [CrossRef] [Google Scholar]
- Kirk, J. G. 1994, in Saas-Fee Advanced Course 24: Plasma Astrophysics, ed. A. O. Benz, & T. J.-L. Courvoisier, 225 [Google Scholar]
- Lacy, M., Laurent-Muehleisen, S. A., Ridgway, S. E., Becker, R. H., & White, R. L. 2001, ApJ, 551, L17 [NASA ADS] [CrossRef] [Google Scholar]
- Laor, A., & Behar, E. 2008, MNRAS, 390, 847 [NASA ADS] [CrossRef] [Google Scholar]
- Middelberg, E., Roy, A. L., Nagar, N. M., et al. 2004, A&A, 417, 925 [NASA ADS] [CrossRef] [EDP Sciences] [Google Scholar]
- Nagar, N. M., Falcke, H., Wilson, A. S., & Ho, L. C. 2000, ApJ, 542, 186 [NASA ADS] [CrossRef] [Google Scholar]
- Orienti, M., & Dallacasa, D. 2008, A&A, 487, 885 [NASA ADS] [CrossRef] [EDP Sciences] [Google Scholar]
- Panessa, F., Barcons, X., Bassani, L., et al. 2007, A&A, 467, 519 [NASA ADS] [CrossRef] [EDP Sciences] [Google Scholar]
- Polletta, M., Courvoisier, T., Hooper, E. J., & Wilkes, B. J. 2000, A&A, 362, 75 [NASA ADS] [Google Scholar]
- Rybicki, G. B., & Lightman, A. P. 1979, Radiative processes in astrophysics, ed. G. B. Rybicki, & A. P. Lightman [Google Scholar]
- Sikora, M., Stawarz, Ł., & Lasota, J. 2007, ApJ, 658, 815 [NASA ADS] [CrossRef] [Google Scholar]
- Terashima, Y., & Wilson, A. S. 2003, ApJ, 583, 145 [NASA ADS] [CrossRef] [Google Scholar]
- Ulvestad, J. S., & Ho, L. C. 2001, ApJ, 558, 561 [NASA ADS] [CrossRef] [Google Scholar]
- Ulvestad, J. S., Antonucci, R. R. J., & Barvainis, R. 2005, ApJ, 621, 123 [NASA ADS] [CrossRef] [Google Scholar]
Current usage metrics show cumulative count of Article Views (full-text article views including HTML views, PDF and ePub downloads, according to the available data) and Abstracts Views on Vision4Press platform.
Data correspond to usage on the plateform after 2015. The current usage metrics is available 48-96 hours after online publication and is updated daily on week days.
Initial download of the metrics may take a while.