| Issue |
A&A
Volume 525, January 2011
|
|
|---|---|---|
| Article Number | A106 | |
| Number of page(s) | 7 | |
| Section | Stellar structure and evolution | |
| DOI | https://doi.org/10.1051/0004-6361/201014982 | |
| Published online | 06 December 2010 | |
HST and VLT observations of the neutron star 1E 1207.4–5209⋆
1
Istituto Universitario di Studi Superiori,
Viale Lungo Ticino Sforza 56,
27100
Pavia,
Italy
e-mail: This email address is being protected from spambots. You need JavaScript enabled to view it.
2
INAF, Istituto di Astrofisica Spaziale e Fisica Cosmica di Milano,
via Bassini 15,
20133
Milano,
Italy
3
Istituto Nazionale di Fisica Nucleare, Sez. di Pavia,
via Bassi 6,
27100
Pavia,
Italy
4
Mullard Space Science Laboratory, University College London,
Holmbury St. Mary,
Dorking, Surrey,
RH5 6NT,
UK
5
Università degli Studi di Pavia, Dipartimento di Fisica Nucleare e
Teorica, via Bassi
6, 27100
Pavia,
Italy
6
European Southern Observatory, Karl Schwarzschild-Str. 2, 85748
Garching,
Germany
Received:
12
May
2010
Accepted:
20
June
2010
Abstract
The peculiar central compact object 1E 1207.4−5209 in the G296.5+10.0 supernova remnant has been proposed to be an “anti-magnetar” – a young neutron star born with a weak dipole field. Accretion, possibly of supernova fallback material, has also been invoked to explain a large surface temperature anisotropy as well as the generation of peculiar cyclotron absorption features superimposed on its thermal spectrum. Interestingly enough, a faint optical/infrared source was proposed as a possible counterpart to 1E 1207.4−5209, but later questioned, based on coarse positional coincidence. On the basis of the large offset of 1E 1207.4−5209 with respect to the center of its host supernova remnant, the source should move at ~70 mas yr-1. Thus, we tested the association by measuring the proper motion of the proposed optical counterpart. Using Hubble Space Telescope (HST) observations spanning 3.75 years, we computed a 3σ upper limit of 7 mas yr-1. Absolute astrometry on the same HST data set also places the optical source significantly off the 99% confidence Chandra position. This allows us to safely rule out the association. Using the HST data set, coupled to ground-based observations collected at the ESO/Very Large Telescope (VLT), we set the deepest limits ever obtained on the optical/infrared emission from 1E 1207.4−5209. By combining these limits with the constraints derived from X-ray timing, we rule out accretion as the source of the thermal anisotropy of the neutron star.
Key words: stars: neutron / pulsars: individual: 1E 1207.4−5209
Based on observations with the NASA/ESA Hubble Space Telescope, obtained at the Space Telescope Science Institute, which is operated by AURA, Inc. under contract No. NAS 5-26555; Based on observations collected at ESO, Paranal, under Programme 70.D-0436(A).
© ESO, 2010
1. Introduction
The X-ray source 1E 1207.4−5209 was discovered with the Einstein satellite (Helfand & Becker 1984) close to the center of G296.5+10.0, a ~7 kyr old supernova remnant (SNR) located at a distance of ~2 kpc (Roger et al. 1988; Giacani et al. 2000). It was the second thermally-emitting, radio-quiet, isolated neutron star (INS) candidate found inside a SNR, after 1E 161348−5055 in RCW 103 (Tuohy & Garmire 1980). A handful of similar sources, discovered inside young SNRs, are dubbed, as a class, central compact objects (CCOs, Pavlov et al. 2002; de Luca 2008, for a review). Although their properties are not well understood, CCOs are supposed to be the youngest members of the radio-quiet INS family.
The source 1E 1207.4−5209 is one of the most peculiar and well observed Galactic X-ray sources. Pulsations at 424 ms were discovered with the Chandra satellite (Zavlin et al. 2000), proving that the source is an INS. Early timing investigations pointed to a non-monotonic period evolution of 1E 1207.4−5209 suggesting that the source could be a peculiar binary system (Zavlin et al. 2004; Woods et al. 2007). However, Gotthelf & Halpern (2007) provided robust evidence that 1E 1207.4−5209 is a very stable rotator. The upper limit to its period derivative (Ṗ < 2.5 × 10⁻¹⁶ s s-1 at 2σ) yields an INS characteristic age τc > 27 Myr, exceeding by 3 orders of magnitude the age of the SNR, a rotational energy loss Ė < 1.3 × 1032 erg s-1, and a very small dipole magnetic field, B < 3.3 × 10¹¹ G. Thus, 1E 1207.4−5209 may be a young, weakly magnetized INS, born with a spin period very similar to the current one. Evidence of similar, low magnetic fields has been obtained for two other members of the CCO class, namely CXOU J185238.6+004020 at the center of the Kes 79 SNR (Halpern et al. 2007) and RX J0822−4300 in Puppis A (Gotthelf & Halpern 2009), adding support to the scenario of CCOs as “anti-magnetars” (with the remarkable exception of the puzzling source in RCW 103, De Luca et al. 2006).
The properties that make 1E 1207.4−5209 unique among all INSs are found by analyzing its X-ray spectrum. Three (possibly four) broad absorption features – at regularly spaced energies (0.7, 1.4, 2.1 and possibly 2.8 keV) – are visible over a thermal two-temperature continuum (Mereghetti et al. 2002; Sanwal et al. 2002; Bignami et al. 2003; De Luca et al. 2004). The depth of these features varies as a function of the rotational phase (Mereghetti et al. 2002; De Luca et al. 2004). The nature of the spectral features of 1E 1207.4−5209 has been debated since their discovery, possible interpretations being atomic transition lines in the NS atmosphere or cyclotron features in the plasma surrounding the star (Sanwal et al. 2002; Mereghetti et al. 2002). The latter interpretation, favoured by the harmonic energy spacing of the features (Bignami et al. 2003; De Luca et al. 2004), is fully consistent with the emerging picture of 1E 1207.4−5209 as a weakly magnetized neutron star: assuming the 0.7 keV feature to be the fundamental electron cyclotron line yields a measure of the magnetic field of 8 × 10¹⁰ G, i.e. below the value derived from the upper limit to the pulsar spin down.
Many puzzles remain to be solved for 1E 1207.4−5209. As stated by Gotthelf & Halpern (2007), it is difficult to explain the luminosity and temperature of the observed hot thermal spectral component within the frame of a weakly magnetized INS. Moreover, the physics underlying the peculiar absorption features (most likely due to cyclotron processes, Liu et al. 2006; Suleimanov et al. 2010; Potekhin 2010) has to be understood. The simplified model proposed by Liu et al. (2006) requires a high (and steady) electron density in the NS magnetosphere above the polar cap. Low-level accretion, possibly of supernova fallback material, has been invoked to ease the problem in both cases. This would point to the existence of a debris disk surrounding the INS (which could be detected in the optical-infrared range), a long sought after astrophysical object, so far possibly observed only in the case of the anomalous X-ray pulsar (AXP) 4U 0142+61 (Wang et al. 2006).
Very deep imaging of the field of 1E 1207.4−5209 has been performed both from the ground with the ESO Very Large Telescope (VLT) and with the Hubble Space Telescope (HST). Optical VLT observations (De Luca et al. 2004) could not identify any potential counterpart down to R ~ 27.1 and V ~ 27.3, while observations in both the optical with the HST and the near infrared (NIR) with the VLT detected a faint source (hereafter “source Z”) close to the Chandra X-ray position, with magnitudes mF555W ~ 26.4 and Ks ~ 20.7 (Pavlov et al. 2004; Fesen et al. 2006). However, the association with 1E 1207.4−5209 was questioned soon after by Mignani et al. (2007a) on the basis of precise absolute astrometry of the HST images, which exhibited a positional offset of source Z with respect to the Chandra coordinates. The same source was observed in the NIR by Wang et al. (2007), who reported very red colors, consistent with an M dwarf, and also questioned its possible association with 1E 1207.4−5209 because of the inconsistency with the Chandra position. Wang et al. (2007) also observed the field with Spitzer at 4.5 μm and at 8.0 μm, but did not detect any source at the target position.
Here we report on a different, independent test to assess the association of source Z with 1E 1207.4−5209, using multi-epoch data collected with the HST (Sect. 2). The same HST dataset, completed by ground-based data collected with the VLT, is also used to derive stringent constraints on the optical/infrared emission from 1E 1207.4−5209 (Sect. 3). Results are discussed in Sect. 4.
2. Association of source Z with 1E 1207.4–5209: an HST test
G296.5+10.0 has a remarkable, well-defined bilateral symmetry (Roger et al. 1988; Storey et al. 1992). The explosion site very likely lies on the symmetry axis of the SNR, but the current position of 1E 1207.4−5209 is significantly offset from the apparent center of the host SNR. Indeed, the geometrical center position evaluated by Roger et al. (1988) is ~8′ to the south west of the X-ray source (De Luca et al. 2004). Assuming for the system an age of 7000 years, this displacement implies a proper motion of ~70 mas yr-1, corresponding to a projected velocity of ~640 km s-1, consistent with the observed velocity distribution for radio pulsars (Hobbs et al. 2005). This offers a natural way to test the proposed identification: if the object were indeed associated with 1E 1207.4−5209, source Z should have a significant proper motion. Thus, we used multi-epoch HST observations to search for an angular displacement of source Z.
2.1. HST observations
We observed the field of 1E 1207.4−5209 with the HST on 2007 May 8
(Programme 10791). Our observations were originally scheduled for execution with the
Wide Field Channel (WFC) of the Advanced
Camera for Surveys (ACS) (Clampin et al. 2000; Sirianni et al.
2005). Unfortunately, the ACS/WFC was put in an idle state on
January 2007 because of a failure of the on board electronics. Our observations were
re scheduled and executed with the Wide Field Planetary Camera 2
(WFPC2). A set of four 500s exposures were obtained during one
spacecraft orbit, through the 814W filter (λ = 8012 Å;
Δλ = 1539 Å). To optimize the spatial resolution for the proper motion
measurement, 1E 1207.4−5209 was placed at the centre of the Planetary Camera
(PC) chip (0 045/pixel).
Our new data complement observations collected with the ACS on
2003 July 28 and 2003 August 7 (Programme 9872) and available in the public
HST archives. This first-epoch HST dataset allowed
Pavlov et al. (2004) to select source Z as a
possible counterpart to 1E 1207.4−5209. The
WFC (0050/pixel)
was used in both visits. Two sequences of 4 and 5 exposures were obtained through the
broad-band filters 555W (λ = 5346 Å;
Δλ = 1193 Å) and 814W (λ = 8333 Å;
Δλ = 2511 Å), for a total integration time of 12 800 s and 10 200 s,
respectively. The complete dataset spans a time baseline of ~3.75 years.
We downloaded the data from the Space Telescope European Coordinating Facility (ST-ECF) Science Data Archive1. On-the-fly data reduction (bias and flat-field correction) and flux calibration were applied using the Space Telescope Science Data Analysis Software (STSDAS) through the ST-ECF Data Archive pipeline. To filter cosmic ray hits, single WFPC2 exposures were combined and averaged using the STSDAS task combine, while single ACS exposures were combined using multidrizzle, which also produces a mosaic image of the two ACS chips and applies a correction for the geometric distortions of the camera.
2.2. Relative astrometry
We used the algorithm that we successfully applied in a series of previous proper motion
measurements with HST (see e.g. De Luca
et al. 2000; Caraveo et al. 2001; Mignani et al. 2002; De
Luca et al. 2007; Mignani et al. 2010). We
used only the ACSF814W bandpass image to avoid
introducing systematic effects when comparing images taken through different filters.
Briefly, a relative reference frame is defined by a grid of good (i.e. not extended, of
high signal-to-noise ratio but not saturated and not too close to the CCD edges) reference
sources common to all images and spread homogeneously across the common field of view. We
selected 32 of these sources and computed their positions by fitting a 2D Gaussian profile
to their brightness profile. The positioning accuracy was between 0.02 and 0.07 pixels per
coordinate for the WFC and between 0.04 and 0.08 pixels for the
PC depending on the source brightness. The position of source Z was
evaluated in the same way, with an uncertainty of 0.08 and 0.04 pixels in the PC
and the WFC image, respectively. For the PC
image, we then corrected the pixel coordinates for the effects of the “34th row
effect” (Anderson & King 1999) as well as
for the geometric distortion (Anderson & King
2003). We then assumed the 2007 image as a reference and aligned the coordinate
grid along right ascension and declination using the well-measured HST
roll angle (≲0.1° uncertainty). We then registered the 2003 reference frame
to the 2007 one by fitting a 5-parameter transformation (including x and
y shifts and scale factors, as well as a rotation angle). We rejected
5 objects with >3σ residuals using an iterative
σ-clipping algorithm. We evaluated a rms residual of 0.17 PC
pixels on the frame registration using 27 reference sources. Finally, we applied
the transformation to the coordinates of source Z to evaluate its possible displacement
between the two epochs. However, this displacement was found to be much smaller than the
overall uncertainty of 0.19 PC pixels. Taking into account the PC
plate scale ( /pixel)
as well as the time baseline covered by our dataset, we can set
a 3σ upper limit of 7 mas yr-1 to the overall proper motion of
source Z. This limit is much lower than the expected proper motion of
~70 mas yr-1 implied by the association between 1E 1207.4−5209 and
the SNR.
/pixel)
as well as the time baseline covered by our dataset, we can set
a 3σ upper limit of 7 mas yr-1 to the overall proper motion of
source Z. This limit is much lower than the expected proper motion of
~70 mas yr-1 implied by the association between 1E 1207.4−5209 and
the SNR.
We note that the proper motion test relies on assumptions about the supernova remnant age and expansion center position. The age is quite uncertain. However, even assuming a value 3 times older than estimated by Roger et al. (1988), we would expect a proper motion of ~25 mas yr-1.
The high bilateral symmetry of G296.5+10.0 suggests that the true expansion center should lie not far from the apparent symmetry axis. However, expansion of the supernova remnant may have been anisotropic. Roger et al. (1988) report a smaller radius of curvature for the eastern side of the SNR with respect to the western side, which is indeed indicative of an expansion center to the east of the geometrical center (i.e. closer to the CCO than the geometrical center), although they did not quantify this effect. We might assume that the true expansion center is placed halfway between 1E 1207.4−5209 and the SNR geometrical center, yielding a factor 2 error in our estimate. Even in this case (and even combining the two pessimistic assumptions), the expected proper motion would have been larger than our upper limit. Thus, this strongly argues against association of source Z to 1E 1207.4−5209.
2.3. Absolute astrometry
A second, model-independent, test about the possible association between 1E 1207.4−5209
and source Z is obviously represented by the comparison of their positions. Before
registering the 1E 1207.4−5209 position with our HST images, we decided
to recompute its X-ray coordinates from the Chandra data, to account for
possible corrections in the satellite aspect solution. To this aim, we retrieved all the
archival Chandra imaging observations of 1E 1207.4−5209. The first
observation was collected with the Advanced CCD imaging Spectrometer
(ACIS-S) on 2003, June 6 (Obs.Id. 3913), totalling ~20 ks;
the second was collected with the High Resolution Camera
(HRC-I) on 2003, December 28 (Obs.Id. 4593) and lasted
~50 ks. Data analysis was performed as in De Luca et al.
(2009). We note that while Mignani et al. (2007) used only the coordinates
derived from the ACIS-S data set, Wang
et al. (2007) used coordinates derived from both data sets. The position of
1E 1207.4−5209 turned out to be α(J2000) =
12h10m0.92s,
δ(J2000) =
−52°26′2840
in the ACIS observation and α(J2000) =
12h10m0.88s,
δ(J2000) =
−52°26′2861
in the HRC observations. The two positions agree to
within  ,
as expected according to Chandra astrometric
accuracy (
,
as expected according to Chandra astrometric
accuracy ( at 90% confidence level2) and are consistent with
those computed by Wang et al. (2007) using the same
data. To evaluate the accuracy of the Chandra absolute astrometry, we
cross-correlated the position of X-ray sources detected within 3′ of the optical axis with
that of stars in the Two Micron All Sky Survey (2MASS, Skrutskie et al. 2006) catalog. We found two matches between 2MASS stars and
sources detected both by the ACIS and HRC. Based on the
source density, we expect a chance alignment of one 2MASS source with a
Chandra source within the nominal 90% error region to have a
probability of 0.6% and of 0.2% for ACIS and HRC,
respectively. Thus, it is very likely that the two 2MASS sources are the IR counterparts
of the matched Chandra sources. The difference between the
Chandra and the 2MASS coordinates of these sources is
~,
consistent with the expected astrometric accuracy of Chandra. Offsets
along right ascension and declination range from
at 90% confidence level2) and are consistent with
those computed by Wang et al. (2007) using the same
data. To evaluate the accuracy of the Chandra absolute astrometry, we
cross-correlated the position of X-ray sources detected within 3′ of the optical axis with
that of stars in the Two Micron All Sky Survey (2MASS, Skrutskie et al. 2006) catalog. We found two matches between 2MASS stars and
sources detected both by the ACIS and HRC. Based on the
source density, we expect a chance alignment of one 2MASS source with a
Chandra source within the nominal 90% error region to have a
probability of 0.6% and of 0.2% for ACIS and HRC,
respectively. Thus, it is very likely that the two 2MASS sources are the IR counterparts
of the matched Chandra sources. The difference between the
Chandra and the 2MASS coordinates of these sources is
~,
consistent with the expected astrometric accuracy of Chandra. Offsets
along right ascension and declination range from  to
to  and have different directions. Thus, no significant plate transformation could be computed
to improve the Chandra astrometry. Using of the USNO-B1 catalog (Monet et al. 2003), we were able to identify one
additional possible coincidence (with a larger
offset ~
and have different directions. Thus, no significant plate transformation could be computed
to improve the Chandra astrometry. Using of the USNO-B1 catalog (Monet et al. 2003), we were able to identify one
additional possible coincidence (with a larger
offset ~ ),
which is of little help.
),
which is of little help.
On the optical side, we then re computed the astrometric calibration of the large-field
of view ACS image against the positions of 35 well-suited reference stars
(i.e., not too faint, not saturated and not close to the CCD edges or to diffraction
spikes) selected from 2MASS3 identified in the mosaic
of the two ACS chips. We measured the pixel coordinates of the 2MASS
sources by means of Gaussian fitting with the Graphical Astronomy and Image
Analysis (GAIA) tool4 and
computed the pixel-to-sky coordinates transformation using the code ASTROM5. This yielded an rms of
 in our astrometric fit, accounting for the rms of the fit in the right ascension and
declination components. Thanks to the pixel scale of the WFC, we
neglected the uncertainty in the reference star centroids. Following Lattanzi et al. (1997), we also estimated the uncertainty in the
registration of the ACS image on the 2MASS reference frame. This is given
by
in our astrometric fit, accounting for the rms of the fit in the right ascension and
declination components. Thanks to the pixel scale of the WFC, we
neglected the uncertainty in the reference star centroids. Following Lattanzi et al. (1997), we also estimated the uncertainty in the
registration of the ACS image on the 2MASS reference frame. This is given
by  ×
×
 ,
where
,
where  accounts for the free parameters in the astrometric fit,
 is the mean positional error of the 2MASS coordinates and Nref
is the number of 2MASS stars used for the astrometric calibration. In our case, we obtain
is the mean positional error of the 2MASS coordinates and Nref
is the number of 2MASS stars used for the astrometric calibration. In our case, we obtain
 .
We finally considered the 0015 uncertainty
in linking 2MASS to the International Celestial Reference Frame (ICRF). Thus, by adding in
quadrature the rms of the astrometric fit and all the above uncertainties, we obtained
that the overall positional accuracy of our ACS astrometry is
.
We finally considered the 0015 uncertainty
in linking 2MASS to the International Celestial Reference Frame (ICRF). Thus, by adding in
quadrature the rms of the astrometric fit and all the above uncertainties, we obtained
that the overall positional accuracy of our ACS astrometry is
 (1σ).
By finally adding in quadrature this value to the error
in the Chandra coordinates we determined an overall uncertainty
of ~
(1σ).
By finally adding in quadrature this value to the error
in the Chandra coordinates we determined an overall uncertainty
of ~ in the registration of the 1E 1207.4−5209 position on the ACS image.
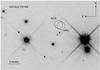 |
Fig. 1 16″ × 11″ cutout of the 2003 ACS image of
1E 1207.4−5209 obtained through the 814W filter. The
Chandra position of the target, as computed using the
ACIS and the HRC observations, is shown. The
circles (0 |
Our results are shown in Fig. 1. Source Z lies
about
and  off the Chandra HRC and ACIS position of
1E 1207.4−5209, respectively. These offsets are larger than the expected 99% accuracy of
Chandra astrometry, which is estimated to be about
off the Chandra HRC and ACIS position of
1E 1207.4−5209, respectively. These offsets are larger than the expected 99% accuracy of
Chandra astrometry, which is estimated to be about  close to the centre of the field of view. As already concluded by Mignani et al. (2007a) and Wang et al.
(2007), the association of source Z with 1E 1207.4−5209 based on positional
coincidence seems very unlikely.
close to the centre of the field of view. As already concluded by Mignani et al. (2007a) and Wang et al.
(2007), the association of source Z with 1E 1207.4−5209 based on positional
coincidence seems very unlikely.
3. Photometry
Results from our HST test allow us to exclude any association of source Z with
1E 1207.4−5209. Thus, we can use the deep ACS images to set upper limits
on any undetected source at the position of 1E 1207.4−5209. We focus on the two deep
ACS observations obtained through the F555W and
F814W filters. To estimate count rates, we used a circular aperture of
 radius
and then we performed aperture correction following Sirianni
et al. (2005). Count rate to magnitude conversions were performed using standard
ACS photometric calibration provided by the data processing pipeline.
Taking into account the observed background noise in a portion of the image surrounding the
position of 1E 1207.4−5209, we set a 3σ upper limit of
mF814W =
28.1 and
mF555W =
28.1. For completeness, we also computed the flux of source Z, which turned out to be
mF814W = 24.71 ±
0.01 and
mF555W = 26.80 ±
0.05. Using the more recent WFPC2 image, we computed
mF814W = 24.83 ± 0.08,
consistent with the ACS flux in the same band. The quoted values are not
dereddened.
radius
and then we performed aperture correction following Sirianni
et al. (2005). Count rate to magnitude conversions were performed using standard
ACS photometric calibration provided by the data processing pipeline.
Taking into account the observed background noise in a portion of the image surrounding the
position of 1E 1207.4−5209, we set a 3σ upper limit of
mF814W =
28.1 and
mF555W =
28.1. For completeness, we also computed the flux of source Z, which turned out to be
mF814W = 24.71 ±
0.01 and
mF555W = 26.80 ±
0.05. Using the more recent WFPC2 image, we computed
mF814W = 24.83 ± 0.08,
consistent with the ACS flux in the same band. The quoted values are not
dereddened.
We include in our photometric study a series of IR observations collected with the
VLT and available in the public ESO archive (Programme 70.D-0436A). Pavlov et al. (2004) and Fesen et al. (2006) reported preliminary results for these data. The
IR observations of 1E 1207.4−5209 were performed in service mode with the Infrared
Spectrometer And Array Camera (ISAAC) instrument at the
VLT (Paranal Observatory) between 2003 January 27 and 2003 March 18. The
ISAAC Short Wavelength (SW) camera was used, with a projected pixel size
of 0148
and a field of view of 152 × 152 arcsec. Observations were performed through the
J (λ = 1.25 μ;
Δλ = 0.29 μ),
H (λ = 1.65 μ;
Δλ = 0.30 μ) and
Ks (λ = 2.16 μ;
Δλ = 0.27 μ) band filters. To allow for the
subtraction of the variable IR sky background, observations in each filter were divided into
sequences of shorter dithered exposures with integration times of 50 s in
the H and Ks bands and of 120 s in the
J band along each point of the dithering pattern. The journal of
observations is reported in Table 1.
Summary of the VLT/ISAAC observations of the 1E 1207.4−5209 field, with the observing epochs, the filter, the total integration time, the average seeing, and airmass values.
The total integration times over all nights were 3480 s (J),
6250 s (H), and 4500 s (Ks). For each band,
observation were taken under photometric conditions with a seeing often better
than 10
and airmass below 1.5. Atmospheric conditions were average with only the nights of
2003 February 11, 16 and 19 affected by a humidity of up to 40%. Twilight flat fields, dark
frames, as well as images of standard stars from the Persson et al. (1998) fields, were
taken daily as part of the ISAAC calibration plan. We downloaded the data
from the ESO public Science Data Archive6 and we
reduced and calibrated them using the updated version of the ESO ISAAC
pipeline7. For each exposure sequence, single frames
were registered and coadded to produce a background subtracted and cosmic-ray free image. We
used the ACS 814W image as a relative reference frame to register the
1E 1207.4−5209 position on the ISAAC images.
Photometry was performed using the SExtractor software8 v2.4, which implements the “first moment” algorithm (Kron 1980). Because of the non-optimal sky conditions, we performed a photometric calibration of each image using a set of 25 2MASS stars as a reference. Our solutions turned out to be very good, with a rms of ~0.1 mag in the J, H, and Ks bands, respectively. The resulting fluxes of source Z are J = 21.53 ± 0.07, H = 20.63 ± 0.11 and Ks = 20.53 ± 0.18. Such results are in broad agreement with Wang et al. (2007) and Fesen et al. (2006). The upper limits to the emission of 1E 1207.4−5209 are J ~ 23.9, H ~ 22.7, and Ks ~ 21.7.
Results of photometry close to the position of 1E 1207.4−5209, based on HST and VLT data.
4. Discussion
Our test with HST, based on both absolute and relative astrometry on multi-epoch images, firmly excludes any physical association of Source Z with 1E 1207.4−5209.
We may ask what is source Z. Multicolor photometry, based on the HST and VLT datasets, points to an unrelated background red dwarf. Flux and colors are consistent with (although slightly redder than) an M5 star located at ~5 kpc, reddened by E(B − V) ~ 0.1. We note that the VLT upper limits based on our 2002 observations in the R band (R > 27.1, De Luca et al. 2004) are inconsistent with the source flux as measured with HST in 2005. This could be due to some intrinsic variability in the dwarf star, and/or to confusion effects in the VLT images, caused by the PSF wings of the two much brighter stars lying a few arcsec away to the south west. Of course, in both cases the conclusion about the non-association of source Z with 1E 1207.4−5209 would not change.
Thus, 1E 1207.4−5209 remains, as yet, unidentified in the optical/IR, as all the other CCOs observed so far (Fesen et al. 2006; De Luca et al. 2008; Mignani et al. 2008, 2009a,b), with the only possible exception of the source in the Vela Jr. SNR (Mignani et al. 2007b). The upper limits to the optical/IR flux presented here are the deepest available so far for a member of the CCO class and correspond to an (unabsorbed) optical-to-X-ray flux ratio F814W/F0.3−3 keV ~ 5 × 10⁻⁶. The spectral energy distribution of 1E 1207.4−5209 is shown in Fig. 2.
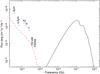 |
Fig. 2 Infrared-to-X-ray spectral energy distribution for 1E 1207.4−5209. Flux limits from HST and VLT data – corrected for interstellar reddening assuming NH = 1.3 × 1021 cm-2 and using the relations by Predehl & Schmitt (1995) and Cardelli et al. (1989) – are shown, together with the limits from Spitzer data given by Wang et al. (2007). The expected flux from a fallback disk, assuming i = 60°, B = 8 × 10¹⁰ G, ṁ = 8 × 10¹¹ g s-1 and rout = 2 × 1012 cm (see text), consistent with the upper limits, is plotted as a red dashed line. The X-ray spectrum as observed by XMM-Newton (De Luca et al. 2004) is also plotted as a solid black line. |
These upper limits virtually rule out the possibility of any stellar companion being tied to the NS in a binary system9. At the distance of 1E 1207.4−5209, taking reddening into account, only a very low-mass star (M ~ 0.1 M⊙) would be allowed. It is very unlikely that a binary system featuring such a low-mass star could survive the supernova explosion.
Combining the constraints from the optical/IR flux limits to the ones derived from the timing properties of the source (Gotthelf & Halpern 2007), we may test the hypothesis of the existence of a disk formed from supernova fallback material, surrounding the NS. Such a debris disk has been invoked as a possible explanation of several puzzling properties of the X-ray source. To compute the expected optical/IR flux from this putative disk, we consider a geometrically thin, optically thick fallback disk, locally emitting as a black body. Following a standard approach, we included two contributions (Perna et al. 2000): (i) viscous dissipation in the disk, yielding a temperature profile T(r) ∝ r−3/4 (Shakura & Sunyaev 1973); (ii) reprocessing of X-rays emitted by the central object. By assuming that LX = 2.2 × 1033 erg s-1 for a distance of 2.2 kpc (De Luca et al. 2004) and a standard disk structure, we infer that T(r) = 1100 K(1 − η)2/7(R⊙/r)3/7 (Vrtilek et al. 1990), where η is the X-ray albedo of the disk. The total flux is obtained by integrating the emissivity over the disk surface and taking into account the inclination of the disk with respect to the line of sight, as well as the source distance. The inner radius of the disk is set at the distance from the star where the magnetic pressure of the rotating dipole of the neutron star disrupts the disk itself. Taking into account the role of viscosity in the disk, this radius is rM ~ 0.5 RM where RM is the so-called Alfvén radius (e.g. Frank et al. 2002). The outer radius of the disk may be constrained by the flux limits. We assumed a disk inclination i = 60°. The contribution of the reprocessed X-ray flux depends critically on the poorly known value of the X-ray albedo η. Although a value η = 0.5 has been assumed in several investigations (e.g. Vrtilek et al. 1990; Perna et al. 2000), a much larger value η = 0.97 was evaluated by Wang et al. (2006), based on the detection of a disk around AXP 4U 0142+61. Thus, we used η = 0.97 (yielding a much lower disk luminosity) in our study.
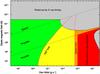 |
Fig. 3 Limits on the neutron star magnetic field and ṁ of a putative fallback disk in 1E 1207.4−5209, set by X-ray timing (Gotthelf & Halpern 2007) and by optical/infrared flux limits. Colors are as follows: (grey) – ruled out by X-ray timing; (red) – ruled out by total X-ray luminosity (assuming d = 2 kpc); (orange) – consistent with X-ray constraints but already ruled out by former Spitzer limits (Wang et al. 2007); (yellow) – consistent with X-ray constraints but ruled out by our HST limits; (green) – parameter region consistent with all constraints. |
In the above assumptions, we computed the expected flux in a specific filter band as a function of the NS magnetic field and disk accretion rate ṁ, for a set of values of the disk outer radius. We repeated this exercise for all of the bands of our optical/infrared dataset. For completeness, we also used the Spitzer 4.5 μm and 8.4 μm bands studied by Wang et al. (2007). The most constraining limit turned out to be those in the HSTF555W and F814W bands reported here. For the allowed range of parameters, the model is rather insensitive to the value of the disk outer radius. The flux contributions are almost negligible in all bands for rout larger than ~3 × 1012 cm. Results are plotted in Fig. 3 where a red line marks the ṁ-B field region allowed by the combination of the F555W and F814W flux limits. The region excluded by the HST limits is colored in yellow. For comparison, we also marked (in orange) the region formerly excluded by the less constraining Spitzer/IRAC 4.5 μm limit. Flux limits in other bands are less constraining than the Spitzer one.
To use the timing constraints (Ṗ < 2.5 × 10⁻¹⁶, Gotthelf & Halpern 2007), we note that the interaction of the putative disk with the rotating neutron star magnetosphere should yield different regimes of angular momentum transfer, according to the relative positions of rM with respect to the neutron star light cylinder as well as to the corotation radius (Illarionov & Sunyaev 1975). We evaluated the expected neutron star Ṗ as a function of the NS magnetic field and disk ṁ in these different regimes (the so-called ejector, propeller, and accretor regimes) using standard relations (e.g. Menou et al. 1999; Zavlin et al. 2004). This allowed us to identify the ṁ-B field region permitted by the existing limit on Ṗ, which is overplotted in Fig. 3. The line marking the Ṗ limit has been drawn arbitrarily (in dashed style) in the small region connecting the propeller regime to the ejector regime (where standard relations for the propeller torque are not valid), to visualize the reduced efficiency of the propeller effect as the magnetospheric radius approaches the light cylinder. The region excluded by X-ray timing is colored in grey. A region in the accretor regime yielding a luminosity higher than 2 × 1033 erg s-1 (i.e. the total X-ray luminosity of 1E 1207.4−5209 assuming a distance of 2 kpc) is also ruled out. It is marked in red.
The region allowed by both the Ṗ limit and the optical/infrared flux limits is colored in green in Fig. 3. We can infer some interesting indications about the possible role of a fallback disk. In the absence of any model describing a quantitative relation between the accretion rate and the phenomenology of the spectral features, we focus here on the issue of the luminosity of the hot spot. The maximum allowed disk ṁ is slightly smaller than 1012 g s-1 in the propeller regime. However, as a consequence of the centrifugal barrier, only a minor fraction (if any) of this mass rate would enter the Alfvén radius. On the other hand, in the accretor regime, which is allowed only for very low magnetic field values (lower than a few 108 G!), we would expect an accretion rate lower than ~5 × 10¹⁰ g s-1. In both the propeller and the accretor pictures, the accretion rate on the INS could yield a luminosity of ~1031 erg s-1. This is about two order of magnitude smaller than the X-ray luminosity of the hot thermal component (~9 × 1032 erg s-1) seen in the X-ray spectrum of 1E 1207.4−5209 (De Luca et al. 2004).
These results are of course model-dependent and should be taken with some caution. However, they point to an alternative origin of the high temperature and luminosity of the hot spot on 1E 1207.4−5209. A very similar picture emerged for PSR J1852+0040, the CCO at the center of the Kes 79 supernova remnant. Halpern & Gotthelf (2010) succeeded in measuring the Ṗ of the INS and ruled out fallback accretion as a heating mechanism for the “hot spot” seen in that source (these hot regions are ubiquitous among CCOs). The same authors concluded that other possible explanations of the thermal anisotropies in CCOs (e.g. localized magnetic heating in a sunspot-like configuration, or anisotropic conduction in a strong poloidal magnetic field in the INS) also have several difficulties, which also apply to the case of 1E 1207.4−5209.
It would be interesting to constrain the total mass contained in the putative fallback disk, for the new flux limits. However, as discussed by Beckwith et al. (1990), the disk is expected to be optically thick at wavelengths shorter than ~1 mm. Thus, a measure of the disk emission at very low frequencies would be required to derive a direct mass estimate. While Wang et al. (2006), in the case of AXP 4U 0142+61, could extrapolate the observed spectral shape of the disk to place a flux limit in the mm band, our upper limits do not allow us to set constraints on the emission of the system at very low frequencies, hampering any direct mass estimate. On the other hand, we can use the limits on the disc ṁ, in addition to a model for fallback disk evolution as a function of time (Cannizzo et al. 1990; Menou et al. 1999; Chatterjee et al. 2000; De Luca et al. 2006). These models expect that, after an initial (uncertain) phase during which supernova fallback material settles into a disk, the disk evolution is ruled by viscous processes and obeys a law ṁ ∝ t−α, with α in the range 1.18−1.25 (depending on the disk opacity). The disc of course interacts with the rotating, magnetized INS and thus affects its spin-down history. We assumed an age of 104 yr for the system, a current disc ṁ = 5 × 10¹¹ g s-1, a dipole B = 8 × 10¹⁰ G field for the neutron star (consistent with a propeller regime, see Fig. 3), and a decay index α = 1.25. The model (similar to the one used by De Luca et al. 2006) allows us to estimate the maximum disk mass at the onset of the disk viscous evolution (t = t0, assuming the INS period P(t0) = 424 ms) consistent with all of the flux and timing limits. This “initial” mass turns out to be as low as 10-6 M⊙. The current disk mass (at t = t0 + 104 yr), according to the model, would be about 104 times lower.
5. Conclusion
We have demonstrated that relative and absolute astrometry on HST datasets rules out the association of a faint optical source with 1E 1207.4−5209. Using HST and VLT data, we have established very deep optical and infrared upper limits to any emission from 1E 1207.4−5209. Our optical/infrared upper limits, coupled with the constraints derived from the limits on Ṗ, argue against the possibility that accretion from a disk of fallback material could explain the existence of a luminous, hot thermal component in the X-ray spectrum of this source. As for other CCOs, the large surface thermal anisotropy remains unexplained. Using published models for the evolution of fallback disks as a function of time, we also have estimated that the mass of any disk currently surrounding the neutron star (at an age of ~104 yr) should be lower than ~10-10 M⊙.
The most likely picture for 1E 1207.4−5209 is that of a young, isolated neutron star, born with a rotation period very similar to the current one, spinning down at an extremely low rate, controlled by a dipole field weaker than ~3 × 10¹¹ G. Most likely, the peculiar cyclotron features seen in the X-ray spectrum of the source are generated very close to the star surface. A very low level of accretion (<5 × 10¹⁰ g s-1) cannot be excluded, and its role for the production of these features should be explored. Using the current generation of ground-based or space observatories, more sensitive optical/IR data would require a very large investment of observing time. The James Webb Space Telescope (JWST), to be launched in 2014, will provide the required sensitivity and spatial resolution in the near-IR to improve on our limits.
Mignani et al. (2007a) used an early release of the Guide Star Catalog 2 (Lasker et al. 2008), while Wang et al. (2007) used the USNO-A2 Catalog (Monet 1998).
The limits on Ṗ leave some room for a long period system containing a small star.
Acknowledgments
R.P.M. thanks STFC for support through its Rolling Grant programme and Martino Romaniello (ESO) for useful discussions. We thank the STScI for support during the re-scheduling of our HST observations.
References
- Anderson, J., & King, I. R. 1999, PASP, 111, 1095 [NASA ADS] [CrossRef] [Google Scholar]
- Anderson, J., & King, I. R. 2003, PASP, 115, 113 [NASA ADS] [CrossRef] [Google Scholar]
- Beckwith, S. V. W., Sargent, A. I., Chini, R. S., & Guesten, R. 1990, AJ, 99, 924 [NASA ADS] [CrossRef] [Google Scholar]
- Bignami, G. F., Caraveo, P. A., De Luca, A., & Mereghetti, S. 2003, Nature, 423, 725 [NASA ADS] [CrossRef] [PubMed] [Google Scholar]
- Cannizzo, J. K., Lee, H. M., & Goodman, J. 1990, ApJ, 351, 38 [NASA ADS] [CrossRef] [Google Scholar]
- Caraveo, P. A., De Luca, A., Mignani, R. P., & Bignami, G. F. 2001, ApJ, 561, 930 [NASA ADS] [CrossRef] [Google Scholar]
- Cardelli, J. A., Clayton, G. C., & Mathis, J. S. 1989, ApJ, 345, 245 [NASA ADS] [CrossRef] [Google Scholar]
- Chatterjee, P., Hernquist, L., & Narayan, R. 2000, ApJ, 534, 373 [NASA ADS] [CrossRef] [Google Scholar]
- Clampin, M., Ford, H. C., Bartko, F., et al. 2000, in SPIE Conf. 4013, ed. J. B. Breckinridge, & P. Jakobsen, 344 [Google Scholar]
- de Luca, A. 2008, in 40 Years of Pulsars: Millisecond Pulsars, Magnetars and More, ed. C. Bassa, Z. Wang, A. Cumming, & V. M. Kaspi, AIP Conf. Ser., 983, 311 [Google Scholar]
- De Luca, A., Mignani, R. P., & Caraveo, P. A. 2000, A&A, 354, 1011 [NASA ADS] [Google Scholar]
- De Luca, A., Mereghetti, S., Caraveo, P. A., et al. 2004, A&A, 418, 625 [NASA ADS] [CrossRef] [EDP Sciences] [Google Scholar]
- De Luca, A., Caraveo, P. A., Mereghetti, S., Tiengo, A., & Bignami, G. F. 2006, Science, 313, 814 [NASA ADS] [CrossRef] [PubMed] [Google Scholar]
- De Luca, A., Mignani, R. P., Caraveo, P. A., & Bignami, G. F. 2007, ApJ, 667, L77 [NASA ADS] [CrossRef] [Google Scholar]
- De Luca, A., Mignani, R. P., Zaggia, S., et al. 2008, ApJ, 682, 1185 [NASA ADS] [CrossRef] [Google Scholar]
- De Luca, A., Caraveo, P. A., Esposito, P., & Hurley, K. 2009, ApJ, 692, 158 [NASA ADS] [CrossRef] [Google Scholar]
- Fesen, R. A., Pavlov, G. G., & Sanwal, D. 2006, ApJ, 636, 848 [NASA ADS] [CrossRef] [Google Scholar]
- Frank, J., King, A., & Raine, D. J. 2002, Accretion Power in Astrophysics: Third Edition, ed. J. Frank, A. King, & D. J. Raine [Google Scholar]
- Giacani, E. B., Dubner, G. M., Green, A. J., Goss, W. M., & Gaensler, B. M. 2000, AJ, 119, 281 [NASA ADS] [CrossRef] [Google Scholar]
- Gotthelf, E. V., & Halpern, J. P. 2007, ApJ, 664, L35 [NASA ADS] [CrossRef] [Google Scholar]
- Gotthelf, E. V., & Halpern, J. P. 2009, ApJ, 695, L35 [NASA ADS] [CrossRef] [Google Scholar]
- Halpern, J. P., & Gotthelf, E. V. 2010, ApJ, 709, 436 [NASA ADS] [CrossRef] [Google Scholar]
- Halpern, J. P., Gotthelf, E. V., Camilo, F., & Seward, F. D. 2007, ApJ, 665, 1304 [NASA ADS] [CrossRef] [Google Scholar]
- Hobbs, G., Lorimer, D. R., Lyne, A. G., & Kramer, M. 2005, MNRAS, 360, 974 [NASA ADS] [CrossRef] [Google Scholar]
- Illarionov, A. F., & Sunyaev, R. A. 1975, A&A, 39, 185 [NASA ADS] [Google Scholar]
- Kron, R. G. 1980, ApJS, 43, 305 [NASA ADS] [CrossRef] [Google Scholar]
- Lasker, B. M., Lattanzi, M. G., McLean, B. J., et al. 2008, AJ, 136, 735 [NASA ADS] [CrossRef] [PubMed] [Google Scholar]
- Lattanzi, M. G., Capetti, A., & Macchetto, F. D. 1997, A&A, 318, 997 [NASA ADS] [Google Scholar]
- Liu, D. B., Yuan, A. F., Chen, L., & You, J. H. 2006, ApJ, 644, 439 [NASA ADS] [CrossRef] [Google Scholar]
- Menou, K., Esin, A. A., Narayan, R., et al. 1999, ApJ, 520, 276 [NASA ADS] [CrossRef] [Google Scholar]
- Mereghetti, S., De Luca, A., Caraveo, P. A., et al. 2002, ApJ, 581, 1280 [NASA ADS] [CrossRef] [Google Scholar]
- Mignani, R. P., De Luca, A., Caraveo, P. A., & Becker, W. 2002, ApJ, 580, L147 [NASA ADS] [CrossRef] [Google Scholar]
- Mignani, R. P., Bagnulo, S., de Luca, A., et al. 2007a, Ap&SS, 308, 203 [NASA ADS] [CrossRef] [Google Scholar]
- Mignani, R. P., de Luca, A., Zaggia, S., et al. 2007b, A&A, 473, 883 [NASA ADS] [CrossRef] [EDP Sciences] [Google Scholar]
- Mignani, R. P., Zaggia, S., de Luca, A., et al. 2008, A&A, 484, 457 [NASA ADS] [CrossRef] [EDP Sciences] [Google Scholar]
- Mignani, R. P., de Luca, A., Mereghetti, S., & Caraveo, P. A. 2009a, A&A, 500, 1211 [NASA ADS] [CrossRef] [EDP Sciences] [Google Scholar]
- Mignani, R. P., de Luca, A., & Pellizzoni, A. 2009b, A&A, 508, 779 [NASA ADS] [CrossRef] [EDP Sciences] [Google Scholar]
- Mignani, R. P., Sartori, A., De Luca, A., et al. 2010, A&A, 515, A110 [NASA ADS] [CrossRef] [EDP Sciences] [Google Scholar]
- Monet, D. 1998, USNO-A2.0, ed. D. Monet [Google Scholar]
- Monet, D. G., Levine, S. E., Canzian, B., et al. 2003, AJ, 125, 984 [NASA ADS] [CrossRef] [Google Scholar]
- Pavlov, G. G., Sanwal, D., Garmire, G. P., & Zavlin, V. E. 2002, in Neutron Stars in Supernova Remnants, ed. P. O. Slane, & B. M. Gaensler, ASP Conf. Ser., 271, 247 [Google Scholar]
- Pavlov, G. G., Sanwal, D., & Teter, M. A. 2004, in Young Neutron Stars and Their Environments, ed. F. Camilo, & B. M. Gaensler, IAU Symp., 218, 239 [Google Scholar]
- Perna, R., Hernquist, L., & Narayan, R. 2000, ApJ, 541, 344 [NASA ADS] [CrossRef] [Google Scholar]
- Potekhin, A. Y. 2010, A&A, accepted [Google Scholar]
- Predehl, P., & Schmitt, J. H. M. M. 1995, A&A, 293, 889 [NASA ADS] [Google Scholar]
- Roger, R. S., Milne, D. K., Kesteven, M. J., Wellington, K. J., & Haynes, R. F. 1988, ApJ, 332, 940 [NASA ADS] [CrossRef] [Google Scholar]
- Sanwal, D., Pavlov, G. G., Zavlin, V. E., & Teter, M. A. 2002, ApJ, 574, L61 [NASA ADS] [CrossRef] [Google Scholar]
- Shakura, N. I., & Sunyaev, R. A. 1973, A&A, 24, 337 [NASA ADS] [Google Scholar]
- Sirianni, M., Jee, M. J., Benítez, N., et al. 2005, PASP, 117, 1049 [NASA ADS] [CrossRef] [Google Scholar]
- Skrutskie, M. F., Cutri, R. M., Stiening, R., et al. 2006, AJ, 131, 1163 [NASA ADS] [CrossRef] [Google Scholar]
- Storey, M. C., Staveley-Smith, L., Manchester, R. N., & Kesteven, M. J. 1992, A&A, 265, 752 [NASA ADS] [Google Scholar]
- Suleimanov, V. F., Pavlov, G. G., & Werner, K. 2010, ApJ, 714, 630 [NASA ADS] [CrossRef] [Google Scholar]
- Tuohy, I., & Garmire, G. 1980, ApJ, 239, L107 [NASA ADS] [CrossRef] [Google Scholar]
- Vrtilek, S. D., Raymond, J. C., Garcia, M. R., et al. 1990, A&A, 235, 162 [NASA ADS] [Google Scholar]
- Wang, Z., Chakrabarty, D., & Kaplan, D. L. 2006, Nature, 440, 772 [NASA ADS] [CrossRef] [PubMed] [Google Scholar]
- Wang, Z., Kaplan, D. L., & Chakrabarty, D. 2007, ApJ, 655, 261 [NASA ADS] [CrossRef] [Google Scholar]
- Woods, P. M., Zavlin, V. E., & Pavlov, G. G. 2007, Ap&SS, 308, 239 [NASA ADS] [CrossRef] [Google Scholar]
- Zavlin, V. E., Pavlov, G. G., Sanwal, D., & Trümper, J. 2000, ApJ, 540, L25 [NASA ADS] [CrossRef] [Google Scholar]
- Zavlin, V. E., Pavlov, G. G., & Sanwal, D. 2004, ApJ, 606, 444 [NASA ADS] [CrossRef] [Google Scholar]
All Tables
Summary of the VLT/ISAAC observations of the 1E 1207.4−5209 field, with the observing epochs, the filter, the total integration time, the average seeing, and airmass values.
Results of photometry close to the position of 1E 1207.4−5209, based on HST and VLT data.
All Figures
|
Fig. 1 16″ × 11″ cutout of the 2003 ACS image of
1E 1207.4−5209 obtained through the 814W filter. The
Chandra position of the target, as computed using the
ACIS and the HRC observations, is shown. The
circles (0 |
| In the text | |
|
Fig. 2 Infrared-to-X-ray spectral energy distribution for 1E 1207.4−5209. Flux limits from HST and VLT data – corrected for interstellar reddening assuming NH = 1.3 × 1021 cm-2 and using the relations by Predehl & Schmitt (1995) and Cardelli et al. (1989) – are shown, together with the limits from Spitzer data given by Wang et al. (2007). The expected flux from a fallback disk, assuming i = 60°, B = 8 × 10¹⁰ G, ṁ = 8 × 10¹¹ g s-1 and rout = 2 × 1012 cm (see text), consistent with the upper limits, is plotted as a red dashed line. The X-ray spectrum as observed by XMM-Newton (De Luca et al. 2004) is also plotted as a solid black line. |
| In the text | |
|
Fig. 3 Limits on the neutron star magnetic field and ṁ of a putative fallback disk in 1E 1207.4−5209, set by X-ray timing (Gotthelf & Halpern 2007) and by optical/infrared flux limits. Colors are as follows: (grey) – ruled out by X-ray timing; (red) – ruled out by total X-ray luminosity (assuming d = 2 kpc); (orange) – consistent with X-ray constraints but already ruled out by former Spitzer limits (Wang et al. 2007); (yellow) – consistent with X-ray constraints but ruled out by our HST limits; (green) – parameter region consistent with all constraints. |
| In the text | |
Current usage metrics show cumulative count of Article Views (full-text article views including HTML views, PDF and ePub downloads, according to the available data) and Abstracts Views on Vision4Press platform.
Data correspond to usage on the plateform after 2015. The current usage metrics is available 48-96 hours after online publication and is updated daily on week days.
Initial download of the metrics may take a while.