Fig. 2
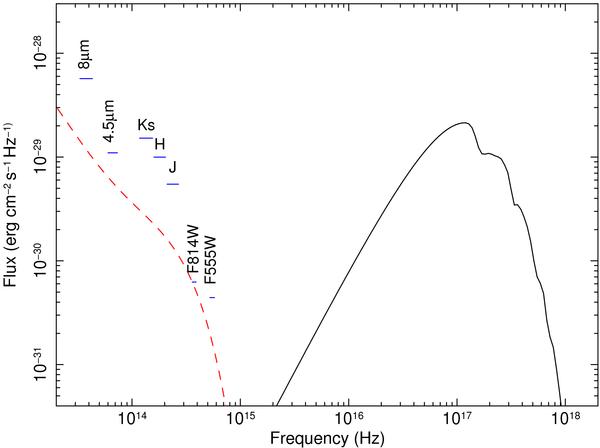
Infrared-to-X-ray spectral energy distribution for 1E 1207.4−5209. Flux limits from HST and VLT data – corrected for interstellar reddening assuming NH = 1.3 × 1021 cm-2 and using the relations by Predehl & Schmitt (1995) and Cardelli et al. (1989) – are shown, together with the limits from Spitzer data given by Wang et al. (2007). The expected flux from a fallback disk, assuming i = 60°, B = 8 × 10¹⁰ G, ṁ = 8 × 10¹¹ g s-1 and rout = 2 × 1012 cm (see text), consistent with the upper limits, is plotted as a red dashed line. The X-ray spectrum as observed by XMM-Newton (De Luca et al. 2004) is also plotted as a solid black line.
Current usage metrics show cumulative count of Article Views (full-text article views including HTML views, PDF and ePub downloads, according to the available data) and Abstracts Views on Vision4Press platform.
Data correspond to usage on the plateform after 2015. The current usage metrics is available 48-96 hours after online publication and is updated daily on week days.
Initial download of the metrics may take a while.