Fig. 6
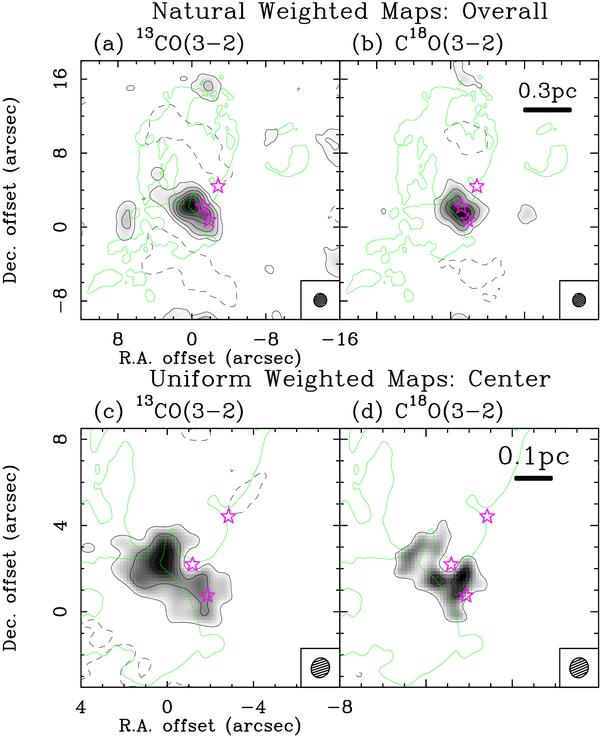
Total integrated intensity maps of the 13CO (3−2) (left panels) and C18O (3−2) (right panels) lines produced with natural (upper panels) and uniform (lower panels) visibility weighting functions. Note that the upper panels show the whole area of the G 19.61−0.23 star-forming region, while the lower panels magnify the region centered on the HMC (greyscale plus thin contour; see Table 2). For comparison purposes, the 7σ level contour of the 6 cm continuum (i.e., free-free) emission as in Fig. 1a is shown by thin green contours. The magenta stars indicate the peak positions of the three 890 μm continuum sources (Table 3). The contours of the CO isotopomer maps start from the 5σ level in steps of 3σ, where the 1σ noise levels are 1.9 and 1.8 Jy beam-1 km s-1 for the natural and uniform weighted 13CO maps, and 0.8 Jy and 1.7 beam-1 km s-1 for the natural and uniform weighted C18O maps, respectively. We integrated the emission over the LSR-velocity ranges 30.2 ≤ VLSR/km s-1 ≤ 42.2 for 13CO, and 34.7 ≤ VLSR/km s-1 ≤ 44.5 for C18O. All the other symbols are the same as those in Fig. 1. The emission seen in the top of the upper-panels is an artifact caused in the cleaning process.
Current usage metrics show cumulative count of Article Views (full-text article views including HTML views, PDF and ePub downloads, according to the available data) and Abstracts Views on Vision4Press platform.
Data correspond to usage on the plateform after 2015. The current usage metrics is available 48-96 hours after online publication and is updated daily on week days.
Initial download of the metrics may take a while.