Fig. 10
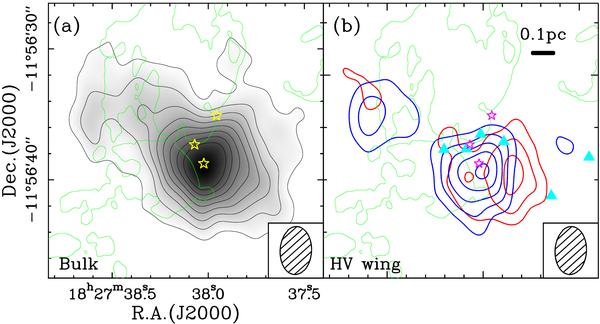
a) Integrated intensity map of the bulk emission of the SiO (2−1) v = 0 line (greyscale plus thin contours) observed with the OVRO and NMA interferometers. The green contours have the same meaning as in Fig. 6. The bulk emission has been integrated over the LSR-velocity range of 31.9 ≤ VLSR/km s-1 ≤ 48.4, and the rms noise level is 0.28 Jy beam-1 km s-1. The yellow stars represent the positions of SMA1, SMA2, and SMA3 (see Table 3). b) Overlay of the blue- and redshifted wing emission maps of the SiO (2−1) v = 0 emission. The contours are spaced by 2σ and start at the 3σ level. The blue- and redshifted wing emission maps have been obtained by averaging the wing emission over the intervals 21.1 < VLSR/km s-1 < 31.9 and 48.4 < VLSR/km s-1 < 58.0, and their rms noise levels are 11.6 and 13.9 mJy beam-1, respectively. The hatched ellipses in the bottom right indicates the FWHM of the synthesized beam (Table 2).
Current usage metrics show cumulative count of Article Views (full-text article views including HTML views, PDF and ePub downloads, according to the available data) and Abstracts Views on Vision4Press platform.
Data correspond to usage on the plateform after 2015. The current usage metrics is available 48-96 hours after online publication and is updated daily on week days.
Initial download of the metrics may take a while.