Fig. 1
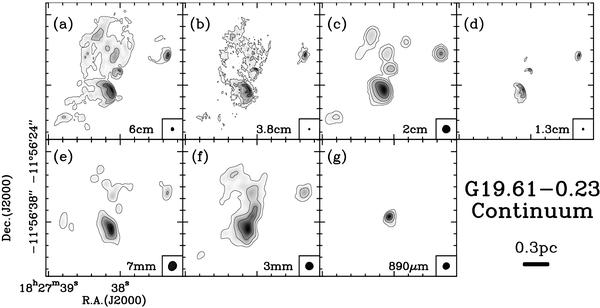
Continuum emission maps toward the G 19.61−0.23 high-mass star-forming region. All the contour levels are drawn with ± 7σ·2n, where σ is the rms noise level of the image (Table 1) and n = 0,1,2,... . The wavelength and FWHM of the synthesized beam are indicated in the bottom right corner of each panel. See Table 1 for the values of the synthesized beams.
Current usage metrics show cumulative count of Article Views (full-text article views including HTML views, PDF and ePub downloads, according to the available data) and Abstracts Views on Vision4Press platform.
Data correspond to usage on the plateform after 2015. The current usage metrics is available 48-96 hours after online publication and is updated daily on week days.
Initial download of the metrics may take a while.