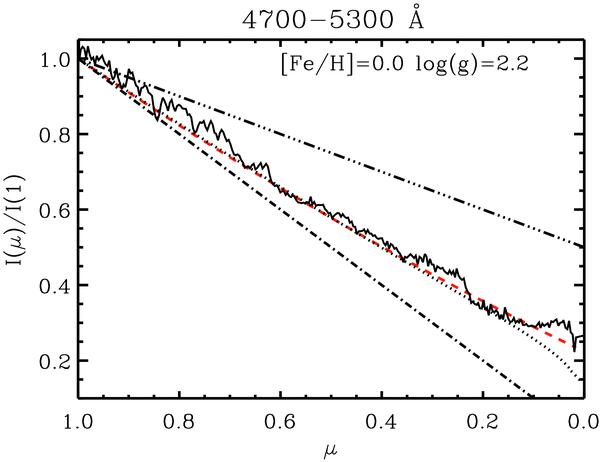
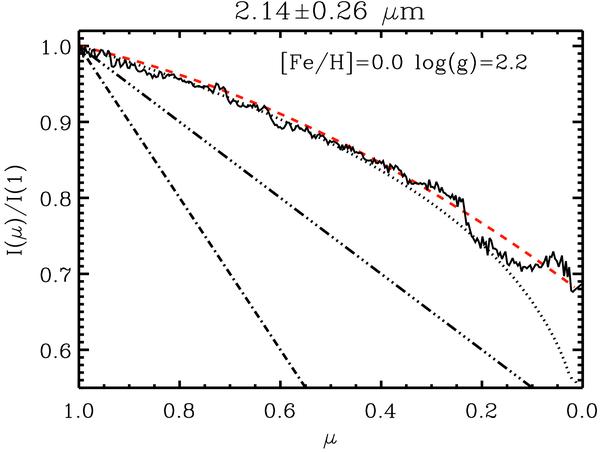
Fig. 6
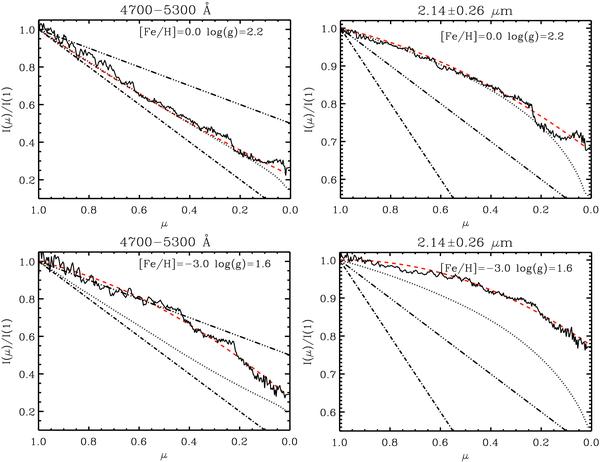
LD fits (red dashed line) obtained using the Eq. (1) with N = 2 for the RHD azimuthally average intensity profile (solid line) of two simulations of Table 1. The dotted line is the intensity profile computed with the 1D model having identical stellar parameters, input data, and chemical compositions as the 3D simulation. A full LD (dash-dotted line), a partial LD (triple dot-dashed line) are also shown.
Current usage metrics show cumulative count of Article Views (full-text article views including HTML views, PDF and ePub downloads, according to the available data) and Abstracts Views on Vision4Press platform.
Data correspond to usage on the plateform after 2015. The current usage metrics is available 48-96 hours after online publication and is updated daily on week days.
Initial download of the metrics may take a while.