Fig. 5
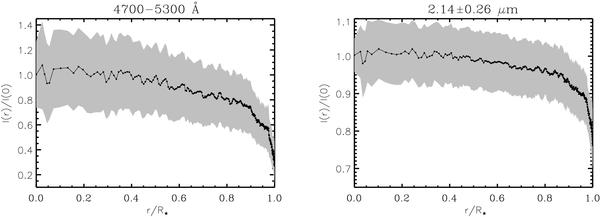
Radially averaged intensity profiles (black line) derived from the synthetic stellar disk images of Fig. 4 and corresponding to RHD simulation with [Fe/H ] = −3.0 and log g = 1.6. The dashed gray areas denote the one sigma spatial fluctuations with respect to the averaged intensity profile. The intensity is normalized to the mean intensity at disk center and the radius is normalized to the radius given in Table 1.
Current usage metrics show cumulative count of Article Views (full-text article views including HTML views, PDF and ePub downloads, according to the available data) and Abstracts Views on Vision4Press platform.
Data correspond to usage on the plateform after 2015. The current usage metrics is available 48-96 hours after online publication and is updated daily on week days.
Initial download of the metrics may take a while.