Fig. 3
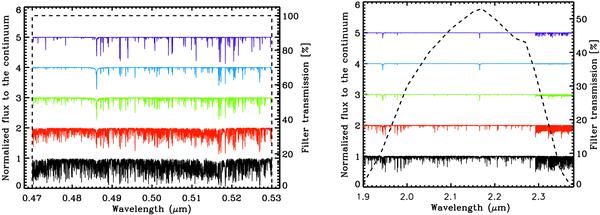
Left panel: synthetic spectra for different 3D model red giant atmospheres in the wavelength range 4700−5300 Å. The intensity maps corresponding to this filter have been computed assuming a top-hat filter (dashed line). This wavelength range corresponds to the VEGA instrument (Mourard et al. 2009) mounted on CHARA with a spectral resolution λ/Δλ = 5000. From the bottom: the black curve refers to the simulation with log g = 2.2 and [Fe/H ] = 0.0 and no offset applied, the red curve to log g = 2.2 and [Fe/H ] = −1.0 with an offset of 1, the green curve to log g = 2.2 and [Fe/H ] = −2.0 with an offset of 2, the light blue curve to log g = 2.2 and [Fe/H ] = −3.0 with an offset of 3, and the dark blue curve log g = 1.6 and [Fe/H ] = −3.0 with an offset of 4 (see Table 1). Right panel: transmission curve (dashed line) of the FLUOR (2.14 ± 0.26 μm) filter (Mérand et al. 2006) mounted on CHARA. Colors and offsets are the same as in left panel.
Current usage metrics show cumulative count of Article Views (full-text article views including HTML views, PDF and ePub downloads, according to the available data) and Abstracts Views on Vision4Press platform.
Data correspond to usage on the plateform after 2015. The current usage metrics is available 48-96 hours after online publication and is updated daily on week days.
Initial download of the metrics may take a while.