Fig. 10
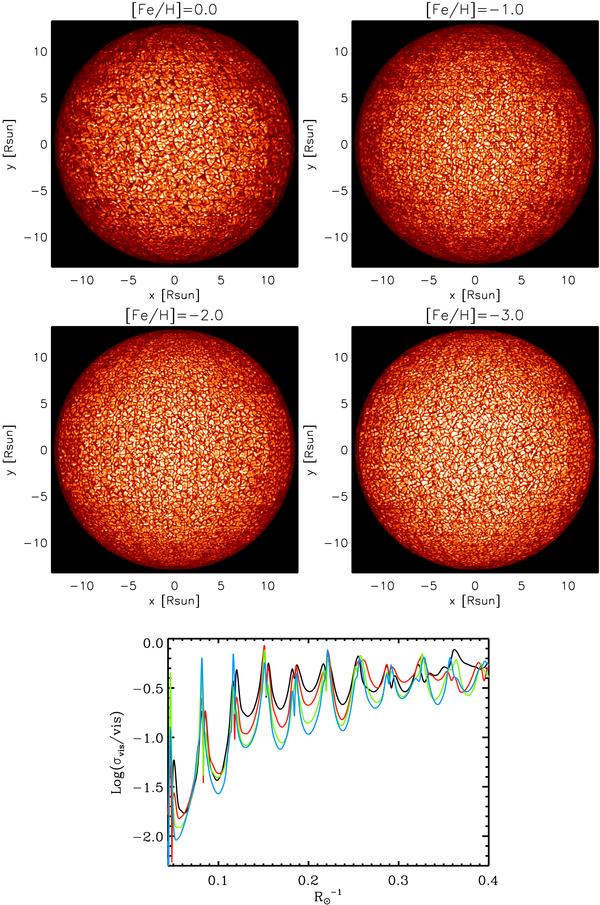
Top and central rows: synthetic stellar disk images in the optical filter for the four simulations of Table 1 having log g = 2.2. The intensity range is [5000, 1.5 × 10⁶] erg cm-2 s-1 Å-1 for [Fe/H ] = 0.0 and −1.0; [5000, 2.0 × 10⁶] erg cm-2 s-1 Å-1 for [Fe/H ] = −2.0 and −3.0. Bottom panel: fluctuations of the synthetic visibility curves derived from the above images. The colors have the same meaning as in Fig. 3. We dropped the first lobe of the visibility curves as in Fig. 7.
Current usage metrics show cumulative count of Article Views (full-text article views including HTML views, PDF and ePub downloads, according to the available data) and Abstracts Views on Vision4Press platform.
Data correspond to usage on the plateform after 2015. The current usage metrics is available 48-96 hours after online publication and is updated daily on week days.
Initial download of the metrics may take a while.