Free Access
Fig. 2
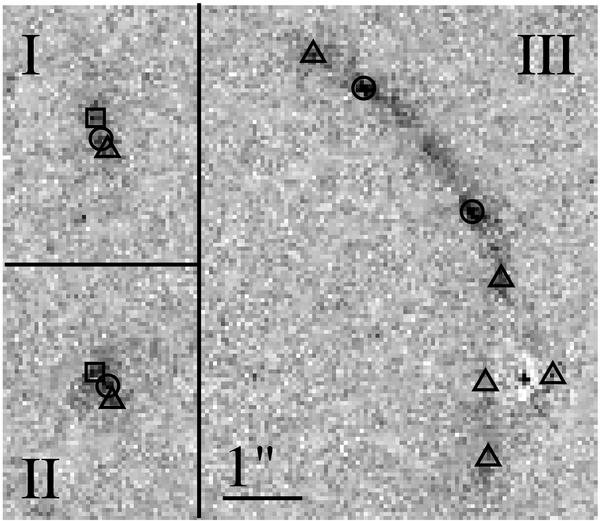
Identification of the multiple images. The three panels (I, II and III) correspond to the regions marked in Fig. 1. These image cutouts are taken from the F606W image with the light from the lens galaxies subtracted. The triangles, circles and squares show the three multiple image systems.
Current usage metrics show cumulative count of Article Views (full-text article views including HTML views, PDF and ePub downloads, according to the available data) and Abstracts Views on Vision4Press platform.
Data correspond to usage on the plateform after 2015. The current usage metrics is available 48-96 hours after online publication and is updated daily on week days.
Initial download of the metrics may take a while.