Fig. 7
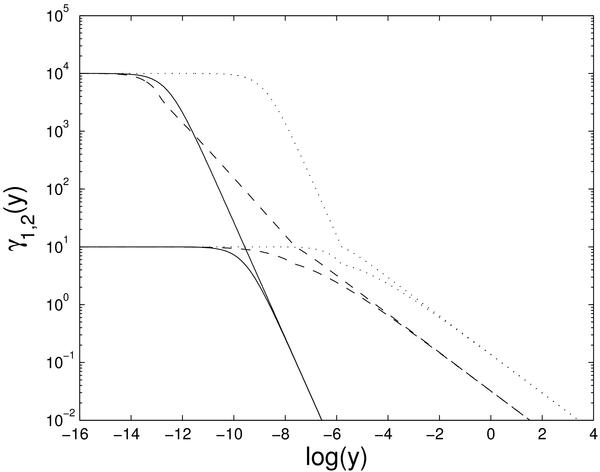
Time dependence of the upper (γ2, upper curves) and lower (γ1, lower curves) cut-offs of the electron spectra, respectively, for the standard values γ1 = 101, γ2 = 104, R15 = 1, and q5 = 1. Full curve: linear electron cooling for s = 2. Dashed curve: nonlinear electron cooling for s = 2. Dotted curve: nonlinear electron cooling for s = 3.5.
Current usage metrics show cumulative count of Article Views (full-text article views including HTML views, PDF and ePub downloads, according to the available data) and Abstracts Views on Vision4Press platform.
Data correspond to usage on the plateform after 2015. The current usage metrics is available 48-96 hours after online publication and is updated daily on week days.
Initial download of the metrics may take a while.